Translated by OfferLand from the original Traditional Chinese post. View original

OfferLand
Oct 30
UK Master's Admit Rates: 1,089 Application Results from Taiwanese Students
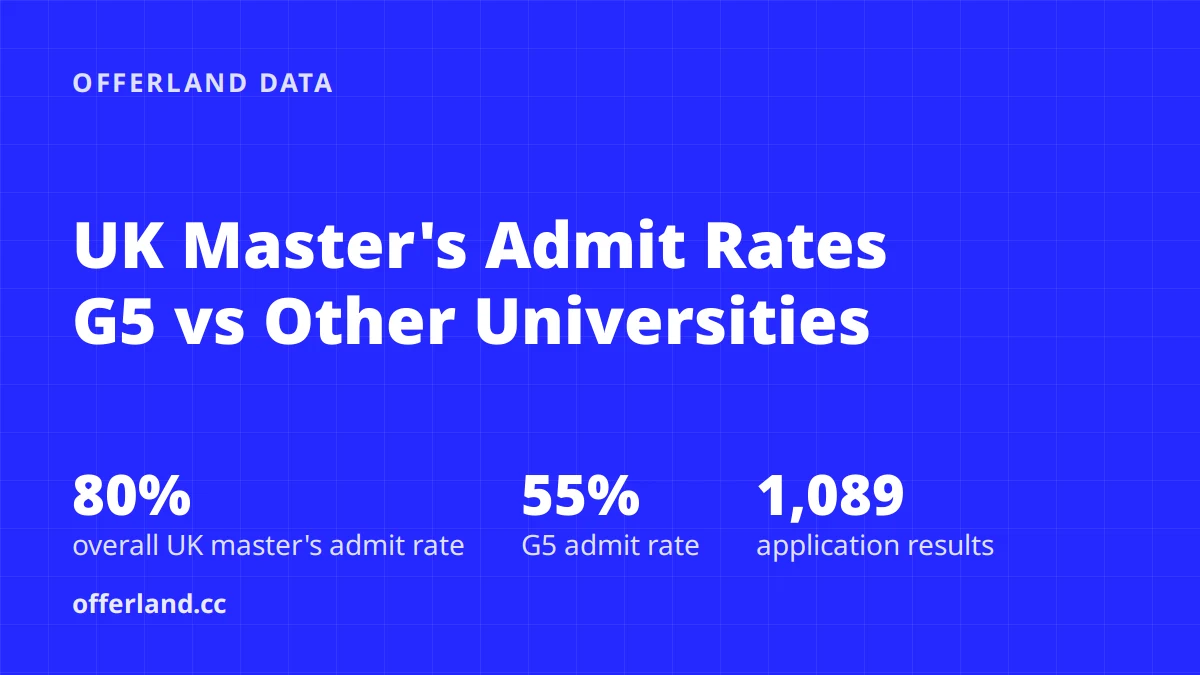
In OfferLand's sample, the overall admit rate for UK master's programs is 80%, but the G5 schools (Oxford, Cambridge, Imperial, LSE, UCL) are at just 55%, versus 87% for other UK schools. Admitted applicants had a median IELTS of 7.0 and a median GPA of 3.69 on a 4.0 scale. Among those who got into a G5 school, the share with IELTS 7.5 or higher is clearly larger. This post covers the data only, not the application process.
Key takeaways
1,089 UK master's results: 858 admits and 214 rejections, for an overall admit rate of 80%.
The G5 admit rate is 55% (242 results with an outcome), versus 87% at non-G5 schools (830 results with an outcome), a gap of 32 percentage points.
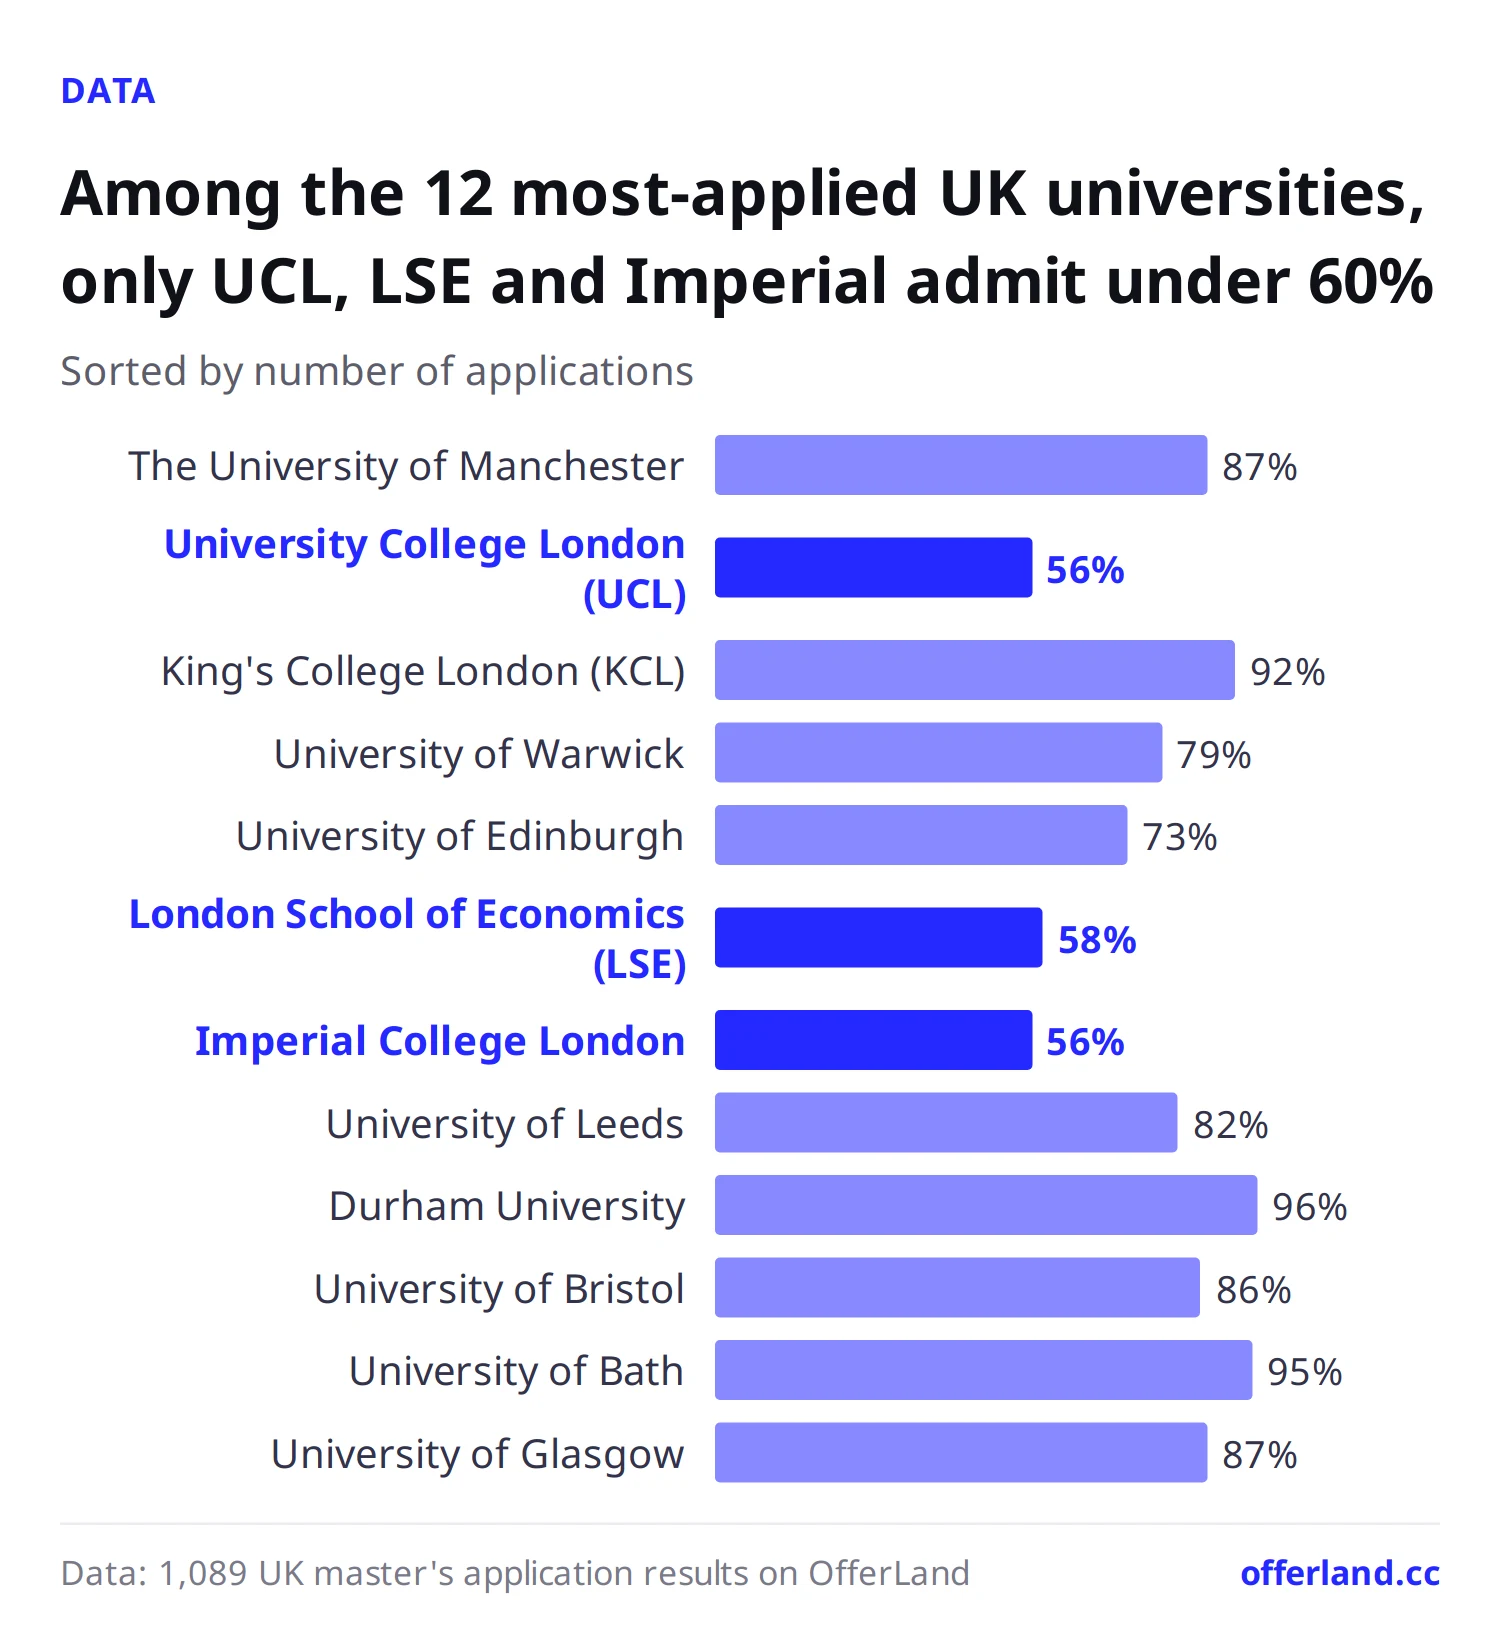
The three most-applied-to schools: Manchester with 120 applications, UCL with 114, and KCL with 102. Their admit rates are 87%, 56%, and 92%.
Admitted applicants' median IELTS is 7.0 (170 people), and 71% scored 7 or higher. 43% of G5 admits scored 7.5 or higher, compared with 28% of non-G5 admits.
Business dominates: business administration, finance, marketing, and business analytics together account for 672 applications, more than 60%.
Most-applied-to UK schools and their admit rates
Taiwanese students applying to the UK concentrate on London and a few large comprehensive universities; the top 10 alone account for 753 applications. The table below lists schools with at least 5 results with an outcome (admit or reject), sorted by number of applications.
School | QS 2027 | Applications | Admitted | Rejected | Admit rate |
|---|---|---|---|---|---|
The University of Manchester | 40 | 120 | 104 | 15 | 87% |
UCL | 8 | 114 | 59 | 46 | 56% |
King's College London (KCL) | 37 | 102 | 91 | 8 | 92% |
University of Warwick | 68 | 72 | 57 | 15 | 79% |
University of Edinburgh | 35 | 69 | 48 | 18 | 73% |
LSE | 62 | 68 | 39 | 28 | 58% |
Imperial College London | 2 | 57 | 32 | 25 | 56% |
University of Leeds | 77 | 56 | 46 | 10 | 82% |
Durham University | 85 | 51 | 49 | 2 | 96% |
University of Bristol | 57 | 44 | 38 | 6 | 86% |
University of Bath | 125 | 42 | 40 | 2 | 95% |
University of Glasgow | 80 | 31 | 27 | 4 | 87% |
University of Birmingham | 68 | 29 | 28 | 1 | 97% |
University of Southampton | 111 | 23 | 21 | 2 | 91% |
London Business School | No QS rank | 22 | 11 | 11 | 50% |
Lancaster University | 164 | 20 | 19 | 1 | 95% |
University of Sheffield | 82 | 19 | 16 | 3 | 84% |
Cranfield University | No QS rank | 15 | 15 | 0 | 100% |
University of Nottingham | 97 | 15 | 13 | 2 | 87% |
Newcastle University | 149 | 13 | 12 | 1 | 92% |
University of Exeter | 136 | 10 | 8 | 2 | 80% |
University of Oxford | 4 | 9 | 2 | 7 | 22% |
University of Liverpool | 139 | 9 | 7 | 2 | 78% |
A few observations:
Only UCL, LSE, Imperial, LBS, and Oxford have admit rates below 60%; almost every other school is above 80%. These few are the main hard-to-get-into UK master's schools.
Durham had only 2 rejections out of 51 applications and KCL only 8 out of 102, making them the two safest popular schools in the sample.
Cambridge has only 4 applications, too few to calculate an admit rate. Oxford rejected 7 of 9; the number is worth noting, but the sample is very small.
How G5 compares with other UK schools
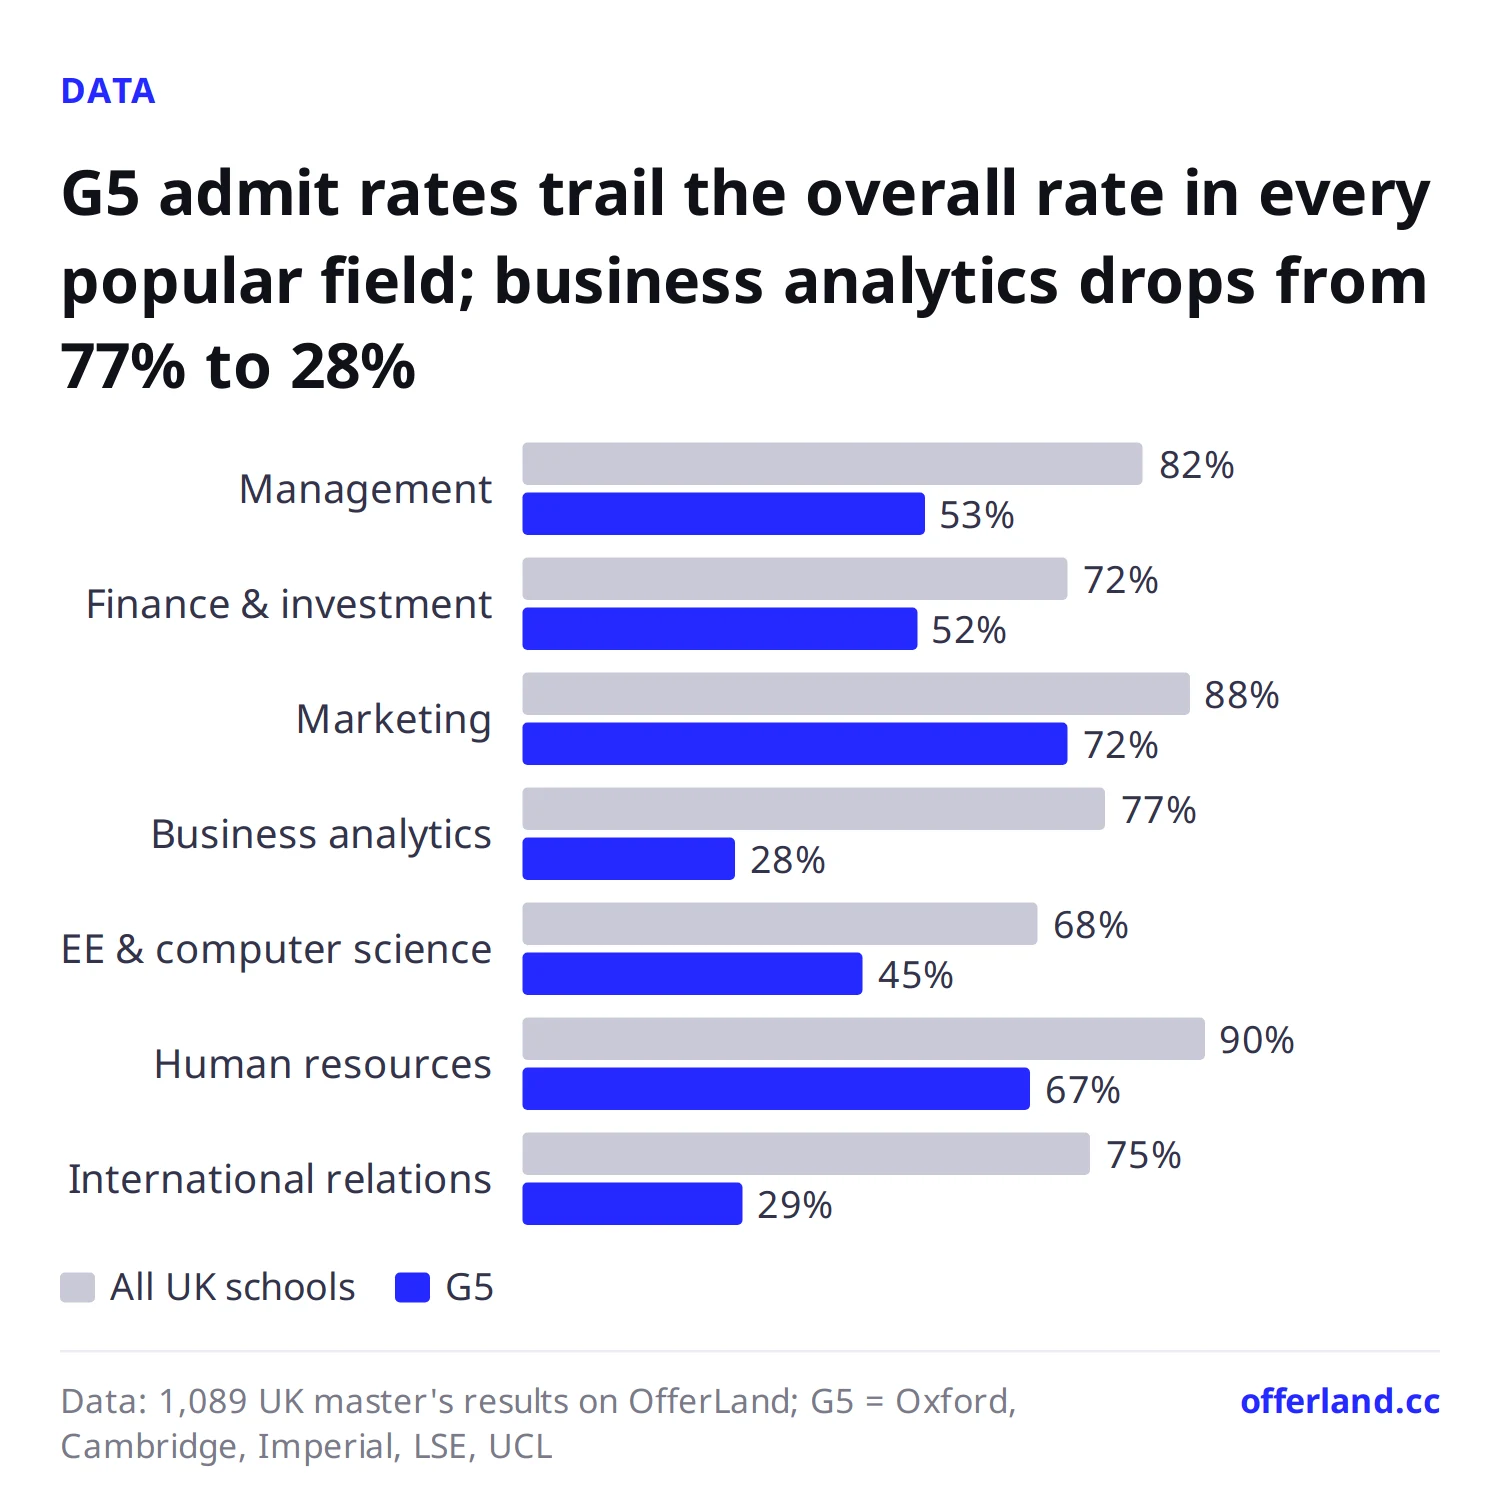
The G5 admit rate is about 60% of the rate at other schools, and the gap shows up in every popular field.
Group | Applications | Applicants | Admitted | Rejected | Admit rate |
|---|---|---|---|---|---|
G5 (Oxford, Cambridge, Imperial, LSE, UCL) | 252 | 144 | 134 | 108 | 55% |
Other UK schools | 837 | 265 | 724 | 106 | 87% |
All | 1,089 | 301 | 858 | 214 | 80% |
Within the G5, UCL has 105 results with an outcome and a 56% admit rate; LSE has 67 and 58%; Imperial has 57 and 56%. In this sample, the three are about equally hard to get into.
Within the same field, the gap between G5 and non-G5 schools is even clearer. The table below lists the fields with the most applications (using OfferLand's main field categories).
Field | Applications | Overall admit rate | Of which G5 | G5 admit rate |
|---|---|---|---|---|
Business Administration (Management, MiM, etc.) | 227 | 82% | 41 | 53% |
Finance and Investment | 211 | 72% | 62 | 52% |
Marketing | 145 | 88% | 18 | 72% |
Business Analytics | 89 | 77% | 18 | 28% |
Electrical Engineering and Computer Science | 42 | 68% | 12 | 45% |
Human Resources | 41 | 90% | 7 | 67% |
International Relations and Diplomacy | 28 | 75% | 7 | 29% |
Business analytics has the biggest gap: 77% overall but only 28% at G5 schools. Finance's overall admit rate of 72% is already the lowest among business fields, and it drops to 52% at the G5.
Most-applied-to UK master's programs
Samples at the program level are smaller, so only programs with 10 or more applications are listed below.
Program | Applications | Admitted | Rejected | Admit rate |
|---|---|---|---|---|
19 | 10 | 9 | 53% | |
16 | 16 | 0 | 100% | |
16 | 15 | 1 | 94% | |
14 | 12 | 2 | 86% | |
14 | 4 | 10 | 29% | |
14 | 14 | 0 | 100% | |
Manchester MSc Finance | 13 | 11 | 2 | 85% |
KCL Finance (Asset Pricing) MSc | 13 | 13 | 0 | 100% |
LBS Masters in Management | 13 | 6 | 7 | 46% |
13 | 7 | 6 | 54% | |
Warwick Finance MSc | 12 | 8 | 4 | 67% |
UCL Management MSc | 12 | 3 | 6 | 33% |
Bath MSc Marketing | 12 | 11 | 1 | 92% |
Both are called Business Analytics, yet Warwick admitted 12 of 14 and UCL only 4 of 14. Choose by program, not just by school name.
Admitted applicants' GPA, IELTS, and TOEFL
Language scores of UK master's admits are tightly clustered: the median IELTS is 7.0, with the middle half between 6.5 and 7.5. The median for G5 admits is also 7.0, but a much larger share scored 7.5 or higher. The figures below count people, using each person's highest score.
Admitted group | IELTS takers | Median IELTS (25th–75th percentile) | IELTS 7+ | IELTS 7.5+ | Median GPA, 4.0 scale (people) | Median GPA, 4.3 scale (people) |
|---|---|---|---|---|---|---|
All UK master's admits | 170 | 7.0 (6.5–7.5) | 71% | 29% | 3.69 (113) | 3.90 (124) |
G5 admits | 51 | 7.0 (7.0–7.5) | 78% | 43% | 3.89 (18) | 3.94 (65) |
Non-G5 admits | 155 | 7.0 (6.5–7.5) | 68% | 28% | 3.69 (112) | 3.89 (92) |
The TOEFL sample is much smaller: only 38 UK master's admits entered a TOEFL score, with a median of 103 (25th–75th percentile 100–107). Relatively few people apply to the UK with TOEFL; IELTS is still the norm.
GPA quartiles: 3.40–3.90 for admits on a 4.0 scale and 3.80–4.06 for admits on a 4.3 scale. Among the 38 people who applied to the G5 and were rejected everywhere, the median GPA was 3.73 on a 4.0 scale (14 people) and 3.91 on a 4.3 scale (18 people), and the median IELTS was also 7.0 (19 people), not far from G5 admits. So at the G5 level, GPA and IELTS are thresholds; they don't decide the outcome.
Scores of admitted applicants by school are below (only schools with 15 or more admits are listed; cells with fewer than 5 people are marked "Insufficient sample").
School | Admits | Median IELTS | IELTS 7+ | Median GPA (4.0 scale) | Median GPA (4.3 scale) |
|---|---|---|---|---|---|
Manchester | 91 | 7.0 | 85% | 3.72 | 3.89 |
KCL | 80 | 7.0 | 78% | 3.80 | 3.91 |
UCL | 54 | 7.0 | 73% | 3.88 | 3.90 |
Warwick | 50 | 7.0 | 75% | 3.80 | 3.89 |
Durham | 49 | 7.0 | 69% | 3.69 | 3.91 |
Edinburgh | 43 | 7.0 | 74% | 3.86 | 3.93 |
Leeds | 42 | 7.0 | 71% | 3.69 | 4.01 |
Bath | 38 | 7.0 | 75% | 3.74 | 3.95 |
Bristol | 38 | 7.0 | 59% | 3.70 | 3.85 |
LSE | 37 | 7.5 | 88% | Insufficient sample | 3.94 |
Imperial | 32 | 7.5 | 83% | 4.00 | 3.95 |
Birmingham | 27 | 7.0 | 67% | 3.46 | 3.83 |
Glasgow | 26 | 7.0 | 68% | 3.53 | 3.84 |
Southampton | 20 | 7.0 | 53% | 3.55 | 3.87 |
Lancaster | 19 | 7.0 | 83% | 3.60 | 3.87 |
Sheffield | 16 | 7.0 | 88% | 3.60 | 3.80 |
Cranfield | 15 | 7.0 | 70% | 3.52 | 3.89 |
Only LSE and Imperial have a median IELTS of 7.5. Birmingham, Glasgow, and Southampton have median GPAs of 3.46–3.55 on a 4.0 scale and are common landing spots for applicants without a high GPA.
As for decision timing, UK master's results come out earlier than in the US, with half arriving before late January. For school-by-school details, see the dedicated post on decision dates.
How to use this data
Build your list in three tiers. Reach: UCL, LSE, Imperial, LBS, Oxford (admit rates 22%–58%). Core: Edinburgh, Warwick, Leeds (73%–82%). Safety: KCL, Durham, Bath, Birmingham (92%–97%). On a list of 5–6 schools, include at least two at 90% or above.
Look at the program, not just the school name. UCL Business Analytics (29%) and Warwick Business Analytics (86%) are 57 percentage points apart. For popular programs, check actual results for that same program in the admission results search.
Get IELTS 7.0 first. 70% of admits had 7.0 or higher; if you're applying to LSE or Imperial, aim for 7.5. Admits with IELTS 6.5 or below make up only 9%.
For the G5, materials beyond your scores matter more. People rejected by the G5 and people admitted have very similar median GPAs and IELTS scores. Your CV, internships, personal statement, and fit with the program are where you can make up ground.
Apply to more schools for finance and business analytics. These two fields have G5 admit rates of 52% and 28%, and are harder to predict than marketing or management.
These are past applicants' results; they don't mean you will definitely be admitted or rejected.
FAQ
Is it easy to get into a UK master's program? What's the admit rate?Across 1,089 UK master's results on OfferLand, the overall admit rate is 80%. But the G5 is at only 55%, and Oxford admitted just 2 of 9. Popular non-G5 schools are mostly between 80% and 97%.
What IELTS score do you need for a UK master's?Admitted applicants' median IELTS is 7.0, and 71% scored 7.0 or higher. The median for LSE and Imperial admits is 7.5. Check each school's official website for the actual requirement; some programs also set minimum sub-scores.
Can you get into a UK master's with a 3.5 GPA?Yes. Among admits on a 4.0 scale, a quarter had a GPA below 3.40. Median GPAs of admits at Birmingham, Glasgow, and Southampton are between 3.46 and 3.55. The median for G5 admits is 3.89, a clearly different level of difficulty.
Which UK schools do Taiwanese students apply to most?By number of applications, the top five are Manchester (120), UCL (114), KCL (102), Warwick (72), and Edinburgh (69).
Further reading
For the UK master's application process, program structure, and document preparation, see this experience post: Applying to and Studying for a Master's in the UK: A Complete Guide to the Application Process, Program Options, and Document Prep.
About the data
"Taiwanese students" means OfferLand users: most of the site's users are students from Taiwan, the data is self-reported, there is no nationality field, and it is not official school data.
Source: statistics from OfferLand's own sample, self-reported by users, not official school data.
Scope: application results where the school is in the UK and the degree is a master's, 1,089 in total from 301 applicants; 97% of results are dated 2022 to 2026. Data as of 2026-10-12.
Admit rate: (admitted + admitted and chose to enroll) ÷ (admitted + admitted and chose to enroll + rejected). Another 13 pending and 4 waitlisted results are not included in the denominator.
G5 definition: Oxford, Cambridge, Imperial, LSE, UCL. LBS is not counted as G5.
GPA: only data on a 4.0 scale (0 to 4.0) and a 4.3 scale (0 to 4.3) is used, with the two counted separately; percentage scales are excluded. Language scores use each person's highest overall score.
Rankings: QS 2027.
Any cell with fewer than 5 results is marked "Insufficient sample." Users are usually more willing to report admits, so actual admit rates may be lower than shown here. Treat these numbers as relative comparisons, not absolute probabilities.
OfferLand editorial team · Jason · Last updated 2026-10-30 · About the editorial team
See which schools admitted applicants with a background like yours
Search resultsSchools in this post
- University College London (UCL)
- The London School of Economics and Political Science (LSE)
- King's College London (KCL)
- The University of Warwick
- London Business School (LBS)
- University of Exeter
See each school's applicant numbers, admit rates and past applicants' results
See admission data for these schools