Translated by OfferLand from the original Traditional Chinese post. View original

OfferLand
Nov 11
US PhD Admission Rates: 412 Results from Taiwanese Applicants
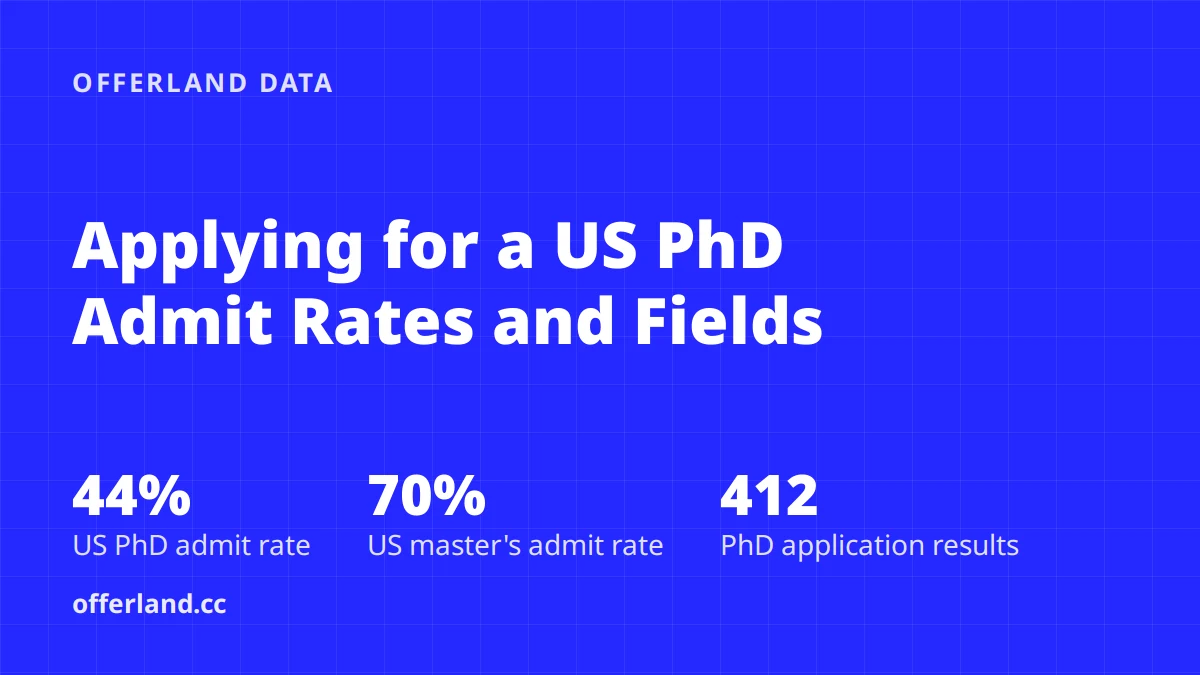
Among the US doctoral (PhD) application results reported on OfferLand, Taiwanese applicants had an overall admit rate of 44%, compared with 70% for US master's programs, a gap of nearly 30 percentage points. Applications were concentrated in three fields: Electrical Engineering and Computer Science, Physics and Chemistry, and General Engineering, which together made up 62%. Admitted applicants had a median GPA of 3.82, higher than the 3.60 of master's admits; their median TOEFL and GRE scores were nearly identical to those of master's admits.
Key takeaways
Overall US PhD admit rate: 44% (180 admits / 410 results with a decision). US master's: 70% (2,526 / 3,583).
Among the 44 applicants who reported 4 or more schools, the per-application admit rate was only 34%. The median applicant applied to 6 schools and got 2 offers; 11% were rejected everywhere.
Electrical Engineering and Computer Science (EECS) accounted for 28% of PhD applications (115), with a 39% admit rate. General Engineering had a 60% admit rate, the highest among the fields with larger samples.
Admitted applicants' medians: GPA 3.82 (4.0 scale, 31 people), TOEFL 99 (73 people), GRE total 319 (33 people).
54% of admits reported a full scholarship, partial scholarship, TA or RA; among the 47 offers that were accepted, the share rose to 77%.
PhD vs. master's: by US News ranking tier
In every ranking tier, the PhD admit rate is 20 to 30 percentage points lower than the master's rate, and the gap widens toward the top. The table below is tiered by the US News 2027 National Universities ranking.
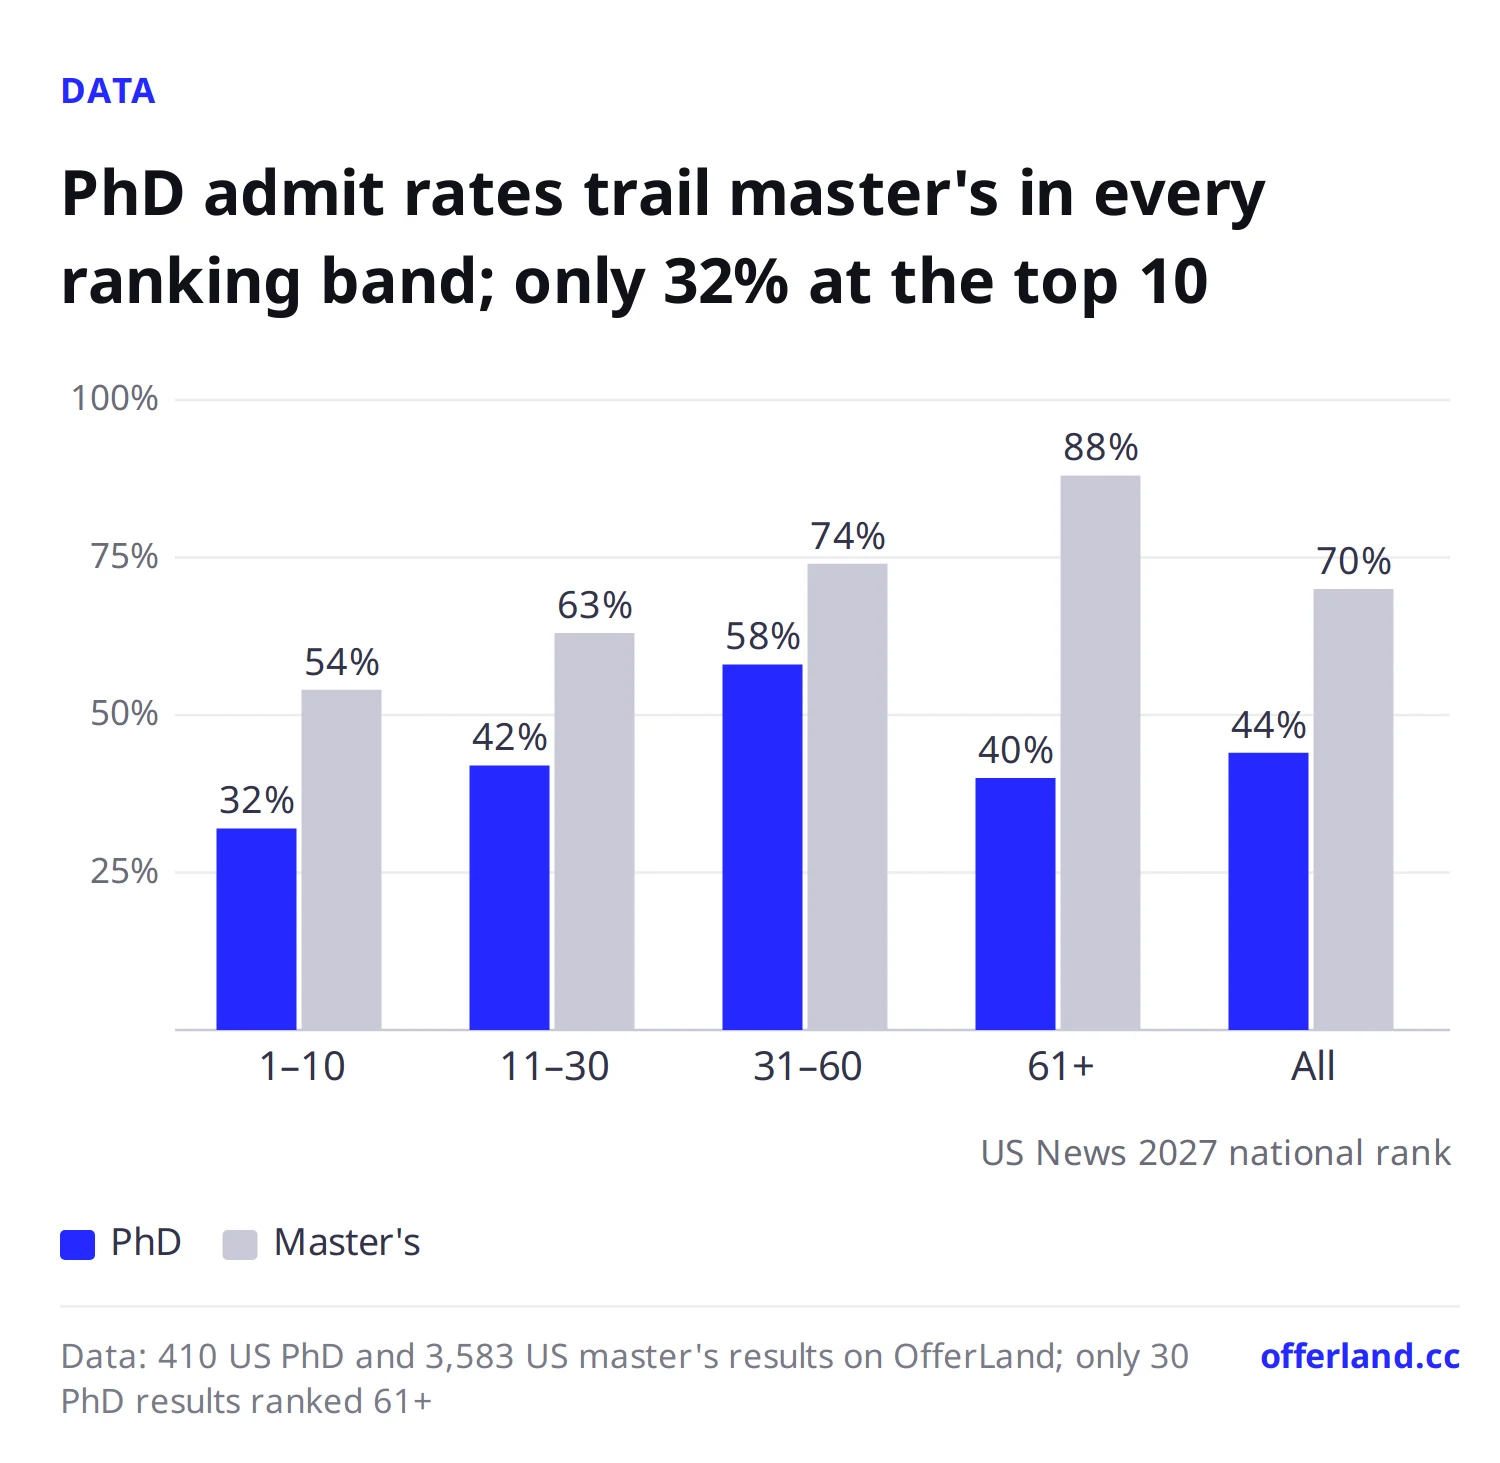
US News 2027 rank | PhD applications | PhD admit rate | Master's applications | Master's admit rate |
|---|---|---|---|---|
1–10 | 122 | 32% | 362 | 54% |
11–30 | 125 | 42% | 1,200 | 63% |
31–60 | 132 | 58% | 1,408 | 74% |
61 and below | 30 | 40% | 593 | 88% |
All (incl. unranked) | 410 | 44% | 3,583 | 70% |
(Applications count only results with an admit or reject decision; waitlisted and pending results are excluded.)
Schools ranked 61 and below have only 30 PhD results, so their 40% admit rate is noisy; don't read it as "lower-ranked schools are harder to get into." The more reliable signal: at top-10 schools, roughly one in three PhD applications ends in an offer.
Also, 39 of the 123 PhD applicants (32%) applied to US master's programs at the same time. Those master's applications had a 57% admit rate, below the site-wide master's rate of 70%. Applicants using a master's as a backup weren't guaranteed a master's offer either.
Why the 44% may be too high
Of the 49 applicants who reported only 1 school, 40 reported an admit, which suggests many people only report the schools that admitted them. Looking only at the 44 applicants who reported 4 or more schools gives a figure closer to reality:
Schools reported | Applicants | Results with a decision | Admit rate |
|---|---|---|---|
1–3 | 79 | 116 | 68% |
4 or more | 44 | 294 | 34% |
The median among these 44 was 6 applications and 2 admits; 27 (61%) got 2 or more offers, and 5 (11%) were rejected everywhere. When planning your school list, 34% is the safer estimate.
Applications and admit rates by field
Electrical Engineering and Computer Science, Physics and Chemistry, and General Engineering alone account for 253 of the 412 results. Admit rates vary quite a bit by field, and General Engineering is clearly easier to get into than EECS or math and the physical sciences.
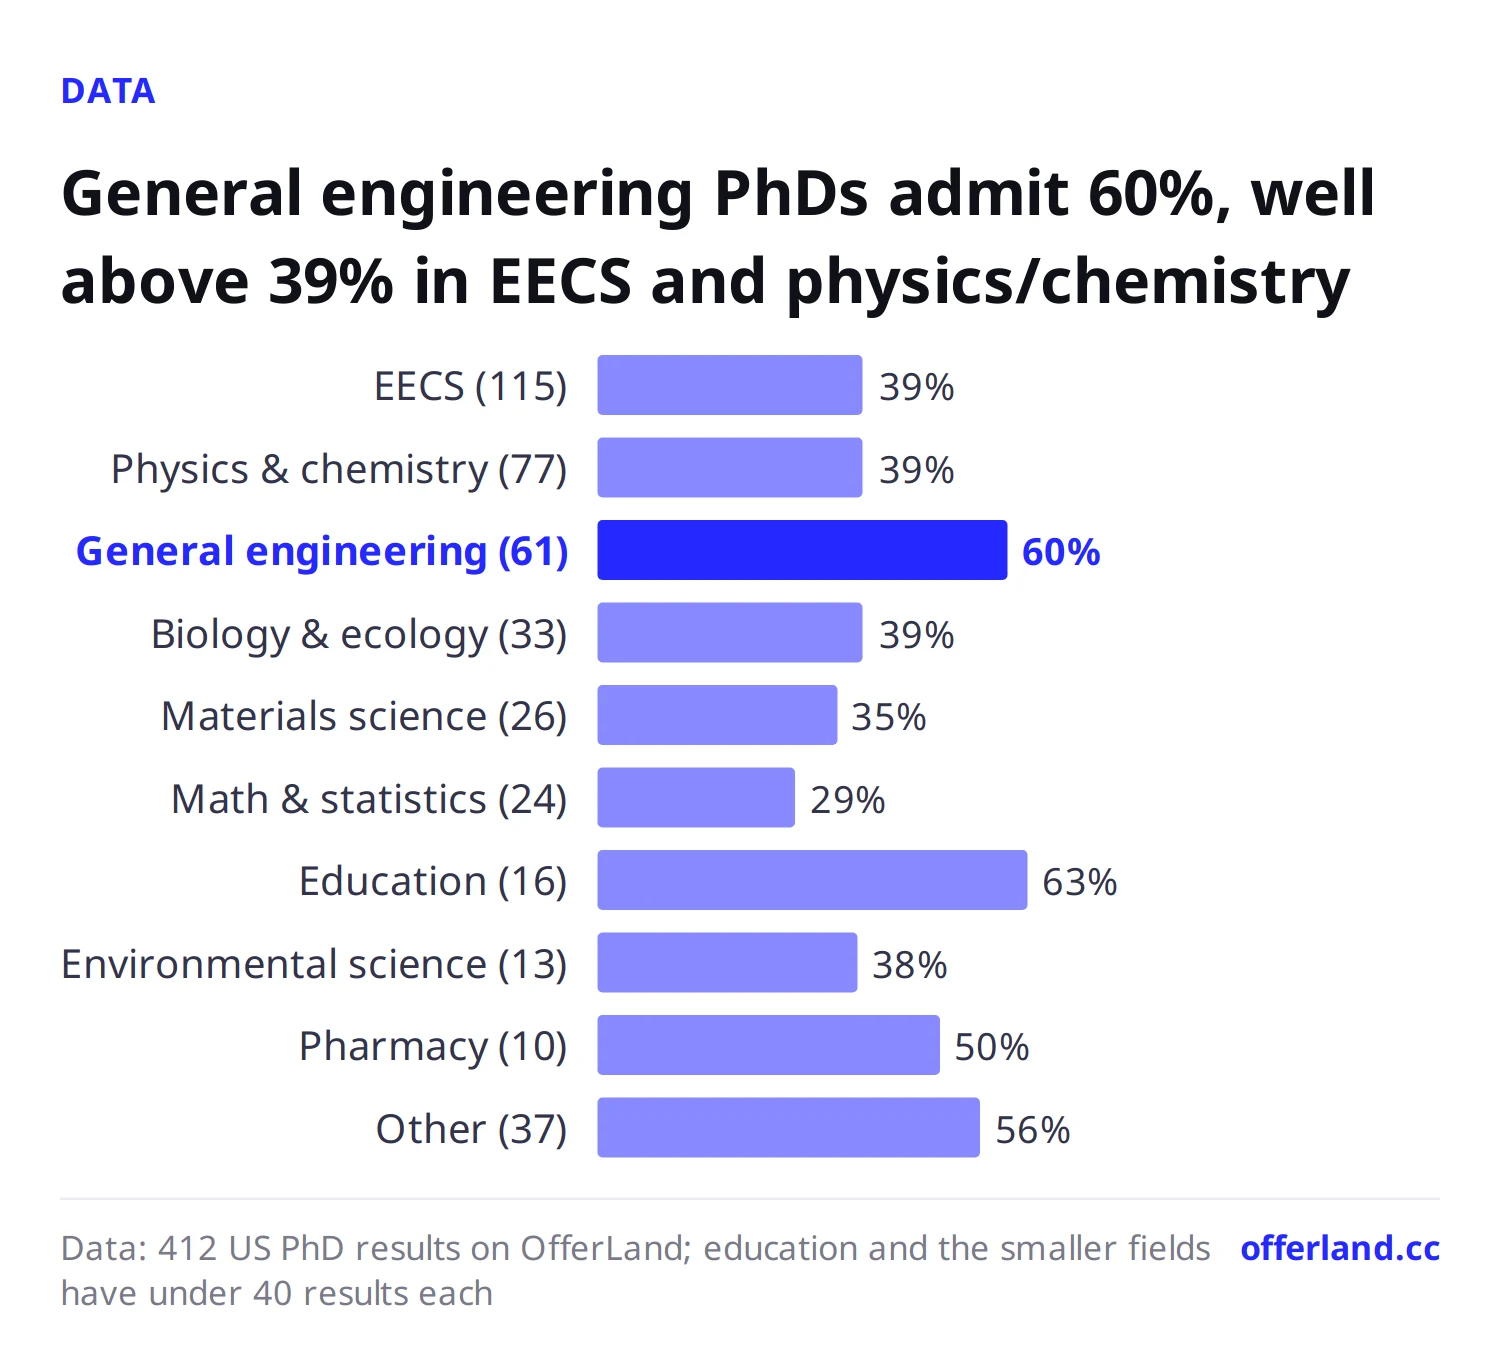
Field (primary category) | Applications | Admits | Rejects | Admit rate |
|---|---|---|---|---|
Electrical Engineering and Computer Science | 115 | 45 | 70 | 39% |
Physics and Chemistry | 77 | 30 | 47 | 39% |
General Engineering (mechanical, civil, chemical, etc.) | 61 | 36 | 24 | 60% |
Biology and Ecology | 33 | 13 | 20 | 39% |
Materials Science | 26 | 9 | 17 | 35% |
Mathematics and Statistics | 24 | 7 | 17 | 29% |
Education | 16 | 10 | 6 | 63% |
Environmental Science | 13 | 5 | 8 | 38% |
Pharmacy | 10 | 5 | 5 | 50% |
Other (economics, psychology, humanities and social sciences, etc.) | 37 | 20 | 16 | 56% |
Mathematics and Statistics has the lowest rate in the table at 29%, but only 24 results. Education, Pharmacy and "Other" all have fewer than 40 results, so treat them as directional only.
Samples for individual popular programs are even smaller. Below are only the PhD programs with 6 or more reports, for reference:
Program | Reports | Admits |
|---|---|---|
8 | 2 | |
7 | 5 | |
7 | 4 | |
UIUC ECE PhD | 6 | 1 |
MIT Materials Science PhD | 6 | 4 |
UC Berkeley EECS PhD | 6 | 0 |
UW–Madison Chemistry PhD | 6 | 3 |
6 | 3 |
Most-applied and most-admitting schools
MIT received the most applications and UT Austin gave the most admits. The table lists schools with 10 or more reports, sorted by number of applications.
School | US News 2027 | Applications | Admits | Admit rate |
|---|---|---|---|---|
1 | 22 | 7 | 32% | |
34 | 21 | 17 | 81% | |
34 | 21 | 9 | 43% | |
UC San Diego | 29 | 19 | 8 | 42% |
55 | 19 | 13 | 68% | |
20 | 18 | 3 | 17% | |
University of Washington | 49 | 18 | 6 | 33% |
Michigan State | 69 | 18 | 4 | 22% |
14 | 18 | 9 | 50% | |
Harvard | 3 | 16 | 3 | 19% |
9 | 16 | 1 | 6% | |
Caltech | 5 | 15 | 7 | 47% |
Stanford | 5 | 15 | 5 | 33% |
UW–Madison | 34 | 14 | 7 | 50% |
Georgia Tech | 29 | 12 | 4 | 33% |
UCLA | 20 | 12 | 5 | 42% |
55 | 10 | 10 | 100% | |
Duke | 8 | 10 | 5 | 50% |
(UW–Madison also has 1 waitlisted or pending result, not counted in the admit rate.)
The top five schools by admits are UT Austin (17), Purdue (13), Penn State (10), UIUC (9) and Cornell (9). All are research universities strong in science and engineering with many PhD slots, and they are where Taiwanese students most often get offers. On the other hand, UC Berkeley admitted only 3 of 18, Northwestern only 1 of 16, and Michigan State, despite its rank of 69, had an admit rate of just 22%. PhD admissions depend on whether a department and its labs need people; the school's ranking is only a reference.
Admitted applicants' GPA, TOEFL and GRE
PhD admits had clearly higher GPAs than master's admits, but similar TOEFL and GRE scores. Each applicant's highest score is used below; anyone with at least one US PhD offer counts as "admitted."
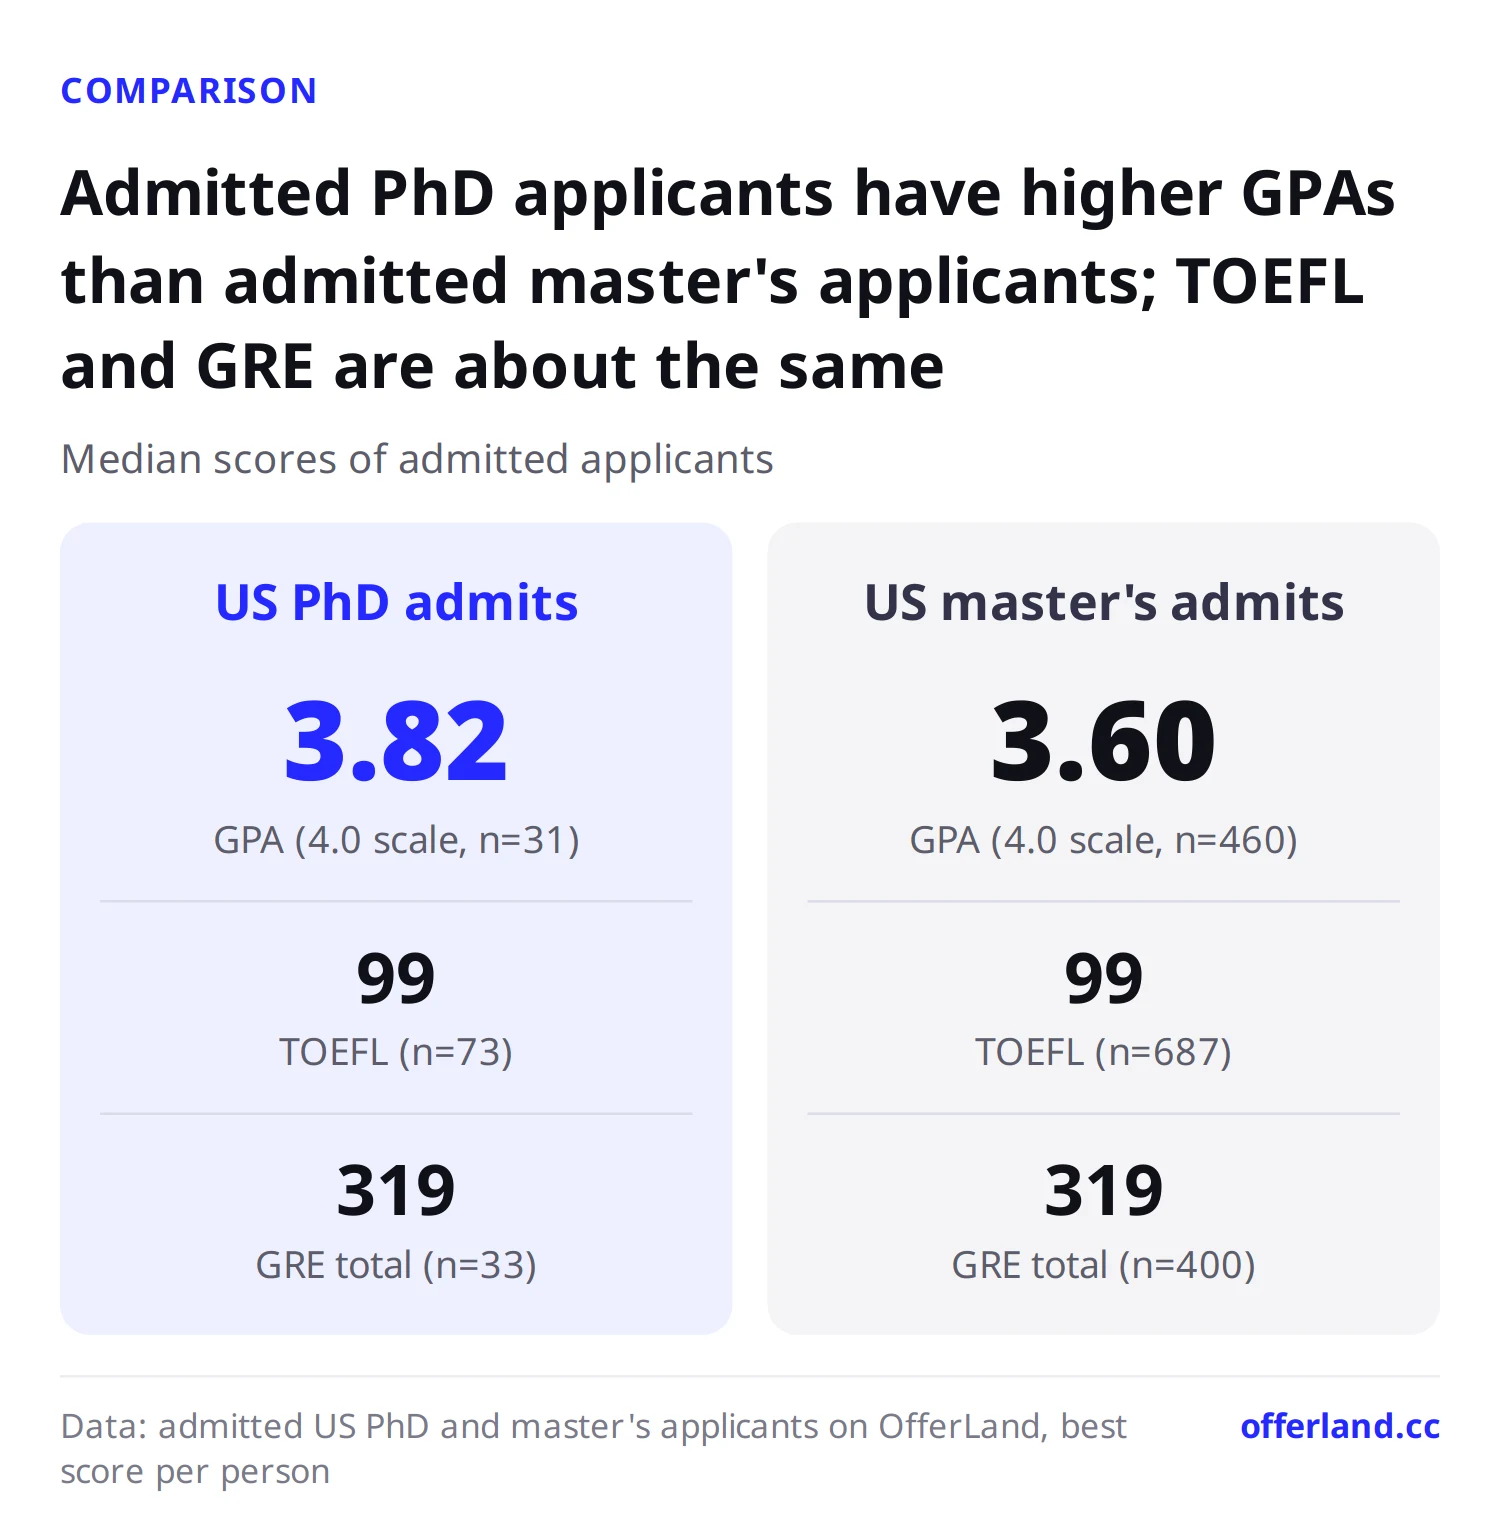
Measure | PhD admits, median (25th–75th percentile) | People | US master's admits, median (25th–75th percentile) | People |
|---|---|---|---|---|
GPA (4.0 scale) | 3.82 (3.70–3.96) | 31 | 3.60 (3.30–3.80) | 460 |
TOEFL total | 99 (95–102) | 73 | 99 (92–103) | 687 |
GRE total | 319 (316–322) | 33 | 319 (314–323) | 400 |
GRE Quant | 168.5 | 33 | 169 | 400 |
GRE Verbal | 154.5 | 33 | 153 | 400 |
The 25th percentile GPA of PhD admits is already 3.70, meaning three-quarters of admits had a GPA of 3.70 or higher. A TOEFL of 99 and a GRE of 319 are scores around the threshold, not where applicants pull ahead.
Another 20 PhD applicants reported being rejected by every US PhD program they applied to. Their median TOEFL was 101 (15 people) and median GRE 321 (11 people), no lower than the admits; only 5 reported a GPA, with a median of 3.83. The sample is small, but the direction is clear: once your scores clear the threshold, what decides the outcome is research experience, recommendation letters, and whether your research interests match a professor's.
Scholarships and funding
Of the 180 admits, 74 (41%) reported a full scholarship, plus 9 partial scholarships, 5 TAs and 9 RAs, so 54% in total reported some form of funding. Of the 47 offers that were accepted, 36 (77%) came with funding. US PhD offers in science and engineering usually include a tuition waiver and a stipend, so "no scholarship" may well mean the field was left blank rather than no funding, and the 54% should be read as a lower bound.
How to use these numbers
Split your list into three tiers, with at least two schools in each. At the per-application rate of 34%, 6 applications should yield about 2 offers. Top-10 PhD programs admit about 32%, so applying only to that tier is very risky; adding high-admit research universities such as UT Austin, Purdue, Penn State and UIUC makes your list safer.
Below a 3.7 GPA, make up for it elsewhere. Three-quarters of PhD admits had 3.70 or higher. If your GPA is on the low side, publications, research assistant experience, master's-level grades and recommendation letters from professors will help more than retaking the GRE.
For TOEFL and GRE, meeting the bar is enough. A TOEFL of about 99 and a GRE of about 319 are already the admits' medians, and rejected applicants scored about the same. Spend your time on your statement of purpose (SOP) and on contacting professors.
Departments in the same field differ a lot. Both are EECS, yet UCSD ECE admitted 5 of 7 reports while UC Berkeley EECS rejected all 6. When choosing schools, look at the department and lab, not just the school's overall ranking.
If a master's is your backup, pick the right tier. PhD applicants who also applied to master's programs had only a 57% master's admit rate. If a master's is your backup, include at least one or two schools with high admit rates.
To look up past admission records for a specific school or program, go to the OfferLand admission results search and filter by Ph.D.
FAQ
Is it hard to get into a US PhD? What is the admit rate for Taiwanese students?The overall US PhD admit rate reported on OfferLand is 44%, but many people only report the schools that admitted them. Among applicants who reported 4 or more schools, the per-application admit rate is 34%, with a median of 6 applications and 2 admits.
What GPA do you need for a US PhD?Admitted applicants had a median GPA of 3.82 (4.0 scale), with a 25th percentile of 3.70. Some applicants below 3.7 were still admitted, but they usually needed research experience or publications to make up for it.
Do US PhD programs require the GRE? What score do you need?Many departments have made the GRE optional. Among PhD admits on the site who reported a GRE, the median was 319, with a Quant median of 168.5, about the same as master's admits, which suggests the GRE is not what sets applicants apart.
How many US PhD programs should you apply to?Applicants with more complete reports applied to a median of 6 schools, and 11% of them were rejected everywhere. We suggest at least 6 to 8 schools, spread across different ranking tiers.
Data methodology
"Taiwanese students" means OfferLand users: the site's users are mostly Taiwanese students, the data is self-reported, there is no nationality field, and these are not official school figures.
Source: OfferLand's own sample, self-reported by users; not official school data.
Sample: 412 application results for Ph.D. programs at US schools, from 123 applicants. Result dates fall mainly in 2023 (178) and 2024 (188), 89% combined; other years have very few results. The comparison group is 3,596 US master's (Masters) results. PhD results outside the US number only 29 (12 in the UK), too few to analyze separately.
Admit rate: (admit + decision, i.e. accepted the offer) ÷ (admit + decision + reject). Waitlist and pending results are excluded from the denominator (2 PhD results in total).
Fields: each program is classified by its primary field (fields_v2, is_primary). Fields with fewer than 10 results or fewer than 5 applicants are grouped into "Other."
Scores: each person's highest score. GPA uses only 4.0-scale values between 0 and 4; TOEFL 0–120; GRE only revised-format totals of 260–340.
Ranking: US News 2027 National Universities.
Every table cell is based on at least 5 results; the school table lists only schools with 10 or more reports.
Reporting bias: users who report only 1 school mostly report admits, so the overall admit rate may be overstated. Data as of October 12, 2026.
Further reading
OfferLand editorial team · Jason · Last updated 2026-11-11 · About the editorial team
See which schools admitted applicants with a background like yours
Search resultsSchools in this post
- University of Texas at Austin (UT Austin)
- University of Illinois at Urbana-Champaign (UIUC)
- University of California, Berkeley (UCB)
- Massachusetts Institute of Technology (MIT)
- University of California, San Diego (UCSD)
- Purdue University
See each school's applicant numbers, admit rates and past applicants' results
See admission data for these schools