Translated by OfferLand from the original Traditional Chinese post. View original

OfferLand
Nov 12
Graduate Admission Rates Ranked: The Hardest and Easiest Schools
On OfferLand, the school with the lowest graduate admit rate is Stanford (14%), followed by MIT (29%), UC Berkeley (31%) and Georgia Tech (35%). The highest are the University of Rochester (97%), the University of Birmingham (97%) and Arizona State University (96%). This ranking covers only the 56 schools with 30 or more admit or reject results, all self-reported by users.
A low admit rate mostly means a school's applicants are concentrated in the most competitive programs; it doesn't mean the school is better. At the 15 schools with the lowest admit rates, 35% of applications were in Electrical Engineering and Computer Science; at the 15 with the highest, business programs made up more than half.
Key takeaways
56 schools on the site have 30 or more admit or reject results, 4,409 in total, with an overall admit rate of 69%.
The 15 lowest-admit schools have 1,166 results combined, a 47% admit rate and a median admitted GPA of 3.71; the 15 highest have 887 results, a 92% admit rate and a median admitted GPA of 3.58.
Across these 56 schools, the 1,431 Electrical Engineering and Computer Science results had a 55% admit rate, versus 82% for Finance and Investment and 78% for Business Analytics.
Programs at the same school differ a lot: UCLA's CS master's had a 12% admit rate across 26 results, while its materials master's was 92% across 13.
QS rankings and on-site admit rates don't line up well: Imperial College London (QS 2) is at 57%, while Georgia Tech (QS 142) is only 35%.
The 15 schools with the lowest admit rates
The table is sorted by on-site admit rate, lowest first. Of the 15 lowest, 12 are in the US and 3 in the UK, all in London (UCL, Imperial, LSE).
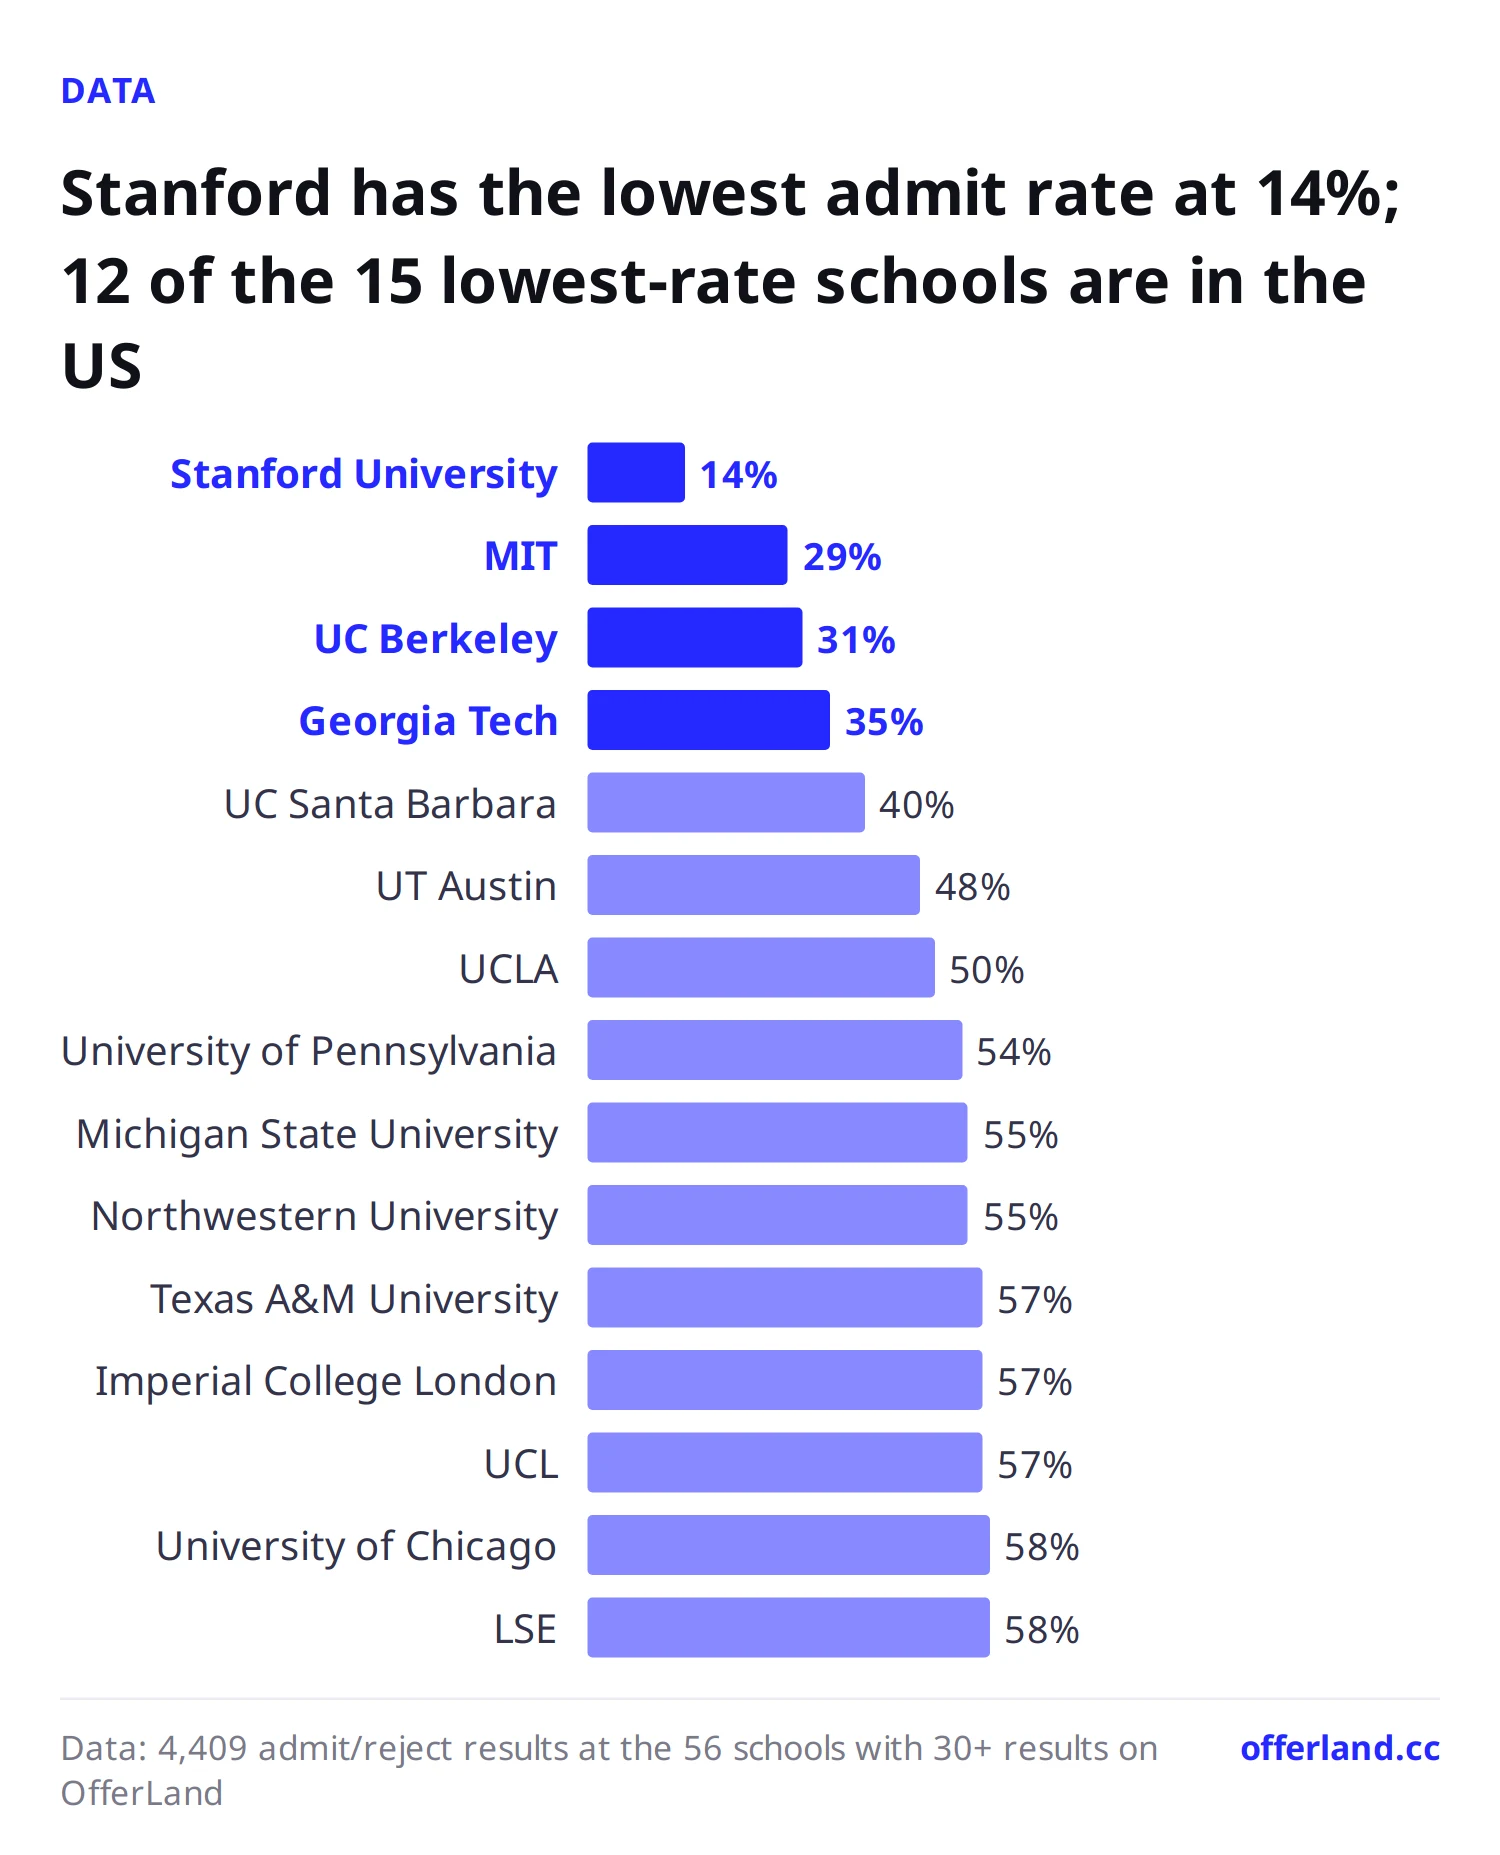
Rank | School | Country | QS 2027 | Results | Applicants | Admit rate | Master's admit rate (results) | Median admitted GPA (people) |
|---|---|---|---|---|---|---|---|---|
1 | US | 2 | 69 | 68 | 14% | 9% (53) | 3.92 (9) | |
2 | US | 1 | 38 | 37 | 29% | 21% (14) | 3.89 (8) | |
3 | US | 20 | 94 | 94 | 31% | 35% (75) | 3.81 (29) | |
4 | US | 142 | 100 | 91 | 35% | 35% (88) | 3.73 (34) | |
5 | US | 173 | 30 | 30 | 40% | 46% (24) | 3.46 (12) | |
6 | US | 72 | 112 | 103 | 48% | 39% (87) | 3.74 (43) | |
7 | US | 49 | 118 | 118 | 50% | 51% (105) | 3.71 (51) | |
8 | US | 15 | 67 | 62 | 54% | 55% (58) | 3.71 (34) | |
9 | US | 182 | 95 | 89 | 55% | 62% (77) | 3.73 (42) | |
10 | US | 45 | 96 | 90 | 55% | 65% (77) | 3.65 (39) | |
11 | US | 169 | 74 | 73 | 57% | 57% (74) | 3.70 (39) | |
12 | UK | 2 | 58 | 57 | 57% | 56% (57) | 3.73 (30) | |
13 | UK | 8 | 108 | 92 | 57% | 56% (105) | 3.77 (46) | |
14 | US | 24 | 40 | 38 | 58% | 66% (35) | 3.75 (19) | |
15 | UK | 62 | 67 | 57 | 58% | 58% (67) | 3.67 (36) |
"Results" counts only admits and rejects; waitlisted and still-pending results are excluded. "Applicants" is the number of people who reported a result at that school; one person applying to two programs at the same school produces two results. Schools with the same rounded admit rate are ordered by the unrounded figure.
Stanford and MIT have the highest median admitted GPAs (3.92 and 3.89), but only 8 and 9 admits entered a GPA, so treat these as rough. 58% of MIT's results are PhD applications and only 14 are master's, so MIT's master's admit rate rests on a thin sample.
The 15 schools with the highest admit rates
Of the 15 highest, 7 are in the UK and 8 in the US. Most median admitted GPAs here fall between 3.4 and 3.7, a bit lower than in the previous table.
Rank | School | Country | QS 2027 | Results | Applicants | Admit rate | Master's admit rate (results) | Median admitted GPA (people) |
|---|---|---|---|---|---|---|---|---|
1 | US | 251 | 33 | 33 | 97% | 97% (31) | 3.60 (24) | |
2 | UK | 68 | 30 | 29 | 97% | 97% (29) | 3.55 (20) | |
3 | US | 172 | 138 | 133 | 96% | 96% (137) | 3.50 (112) | |
4 | UK | 85 | 51 | 51 | 96% | 96% (51) | 3.65 (47) | |
5 | UK | 125 | 43 | 41 | 95% | 95% (42) | 3.71 (36) | |
6 | US | 686 | 78 | 74 | 95% | 95% (76) | 3.41 (65) | |
7 | US | 162 | 36 | 36 | 94% | 97% (30) | 3.69 (27) | |
8 | US | 398 | 31 | 31 | 94% | 93% (27) | 3.42 (28) | |
9 | UK | 37 | 100 | 88 | 92% | 92% (99) | 3.68 (68) | |
10 | US | 385 | 83 | 72 | 88% | 89% (80) | 3.41 (51) | |
11 | UK | 40 | 121 | 105 | 88% | 87% (119) | 3.67 (78) | |
12 | US | 92 | 32 | 32 | 88% | 81% (21) | 3.70 (27) | |
13 | UK | 80 | 31 | 28 | 87% | 87% (31) | 3.53 (25) | |
14 | UK | 57 | 44 | 42 | 86% | 86% (44) | 3.62 (36) | |
15 | US | 549 | 36 | 36 | 86% | 87% (30) | 3.60 (25) |
King's College London (QS 37) and the University of Manchester (QS 40) are both in the QS top 50, yet their on-site admit rates are 92% and 88%. More than 60% of their results are business master's programs; the next section explains how program mix affects admit rates. UK master's programs overall are covered in a separate column, so we won't go into them here.
A low admit rate doesn't mean a better school
Splitting the 56 schools into three groups, the biggest difference is which programs people apply to. GPA is actually higher in the low-admit group.
Group | Schools | Results | Admit rate | EECS share | Business share | Median admitted GPA (people) |
|---|---|---|---|---|---|---|
15 lowest admit rates | 15 | 1,166 | 47% | 35% | 18% | 3.71 (348) |
Middle 26 | 26 | 2,356 | 71% | 38% | 21% | 3.67 (689) |
15 highest admit rates | 15 | 887 | 92% | 14% | 54% | 3.58 (454) |
Business means four fields in fields_v2: Business Analytics, Finance and Investment, Marketing, and Business Administration. The middle 26 schools have an EECS share (38%) similar to the lowest group, yet their admit rate is 24 percentage points higher, so program mix isn't the only cause; how competitive the school itself is and reporting bias also play a part.
Admit rates by field vary widely across these 56 schools, which is why a school's admit rate is driven by who applies:
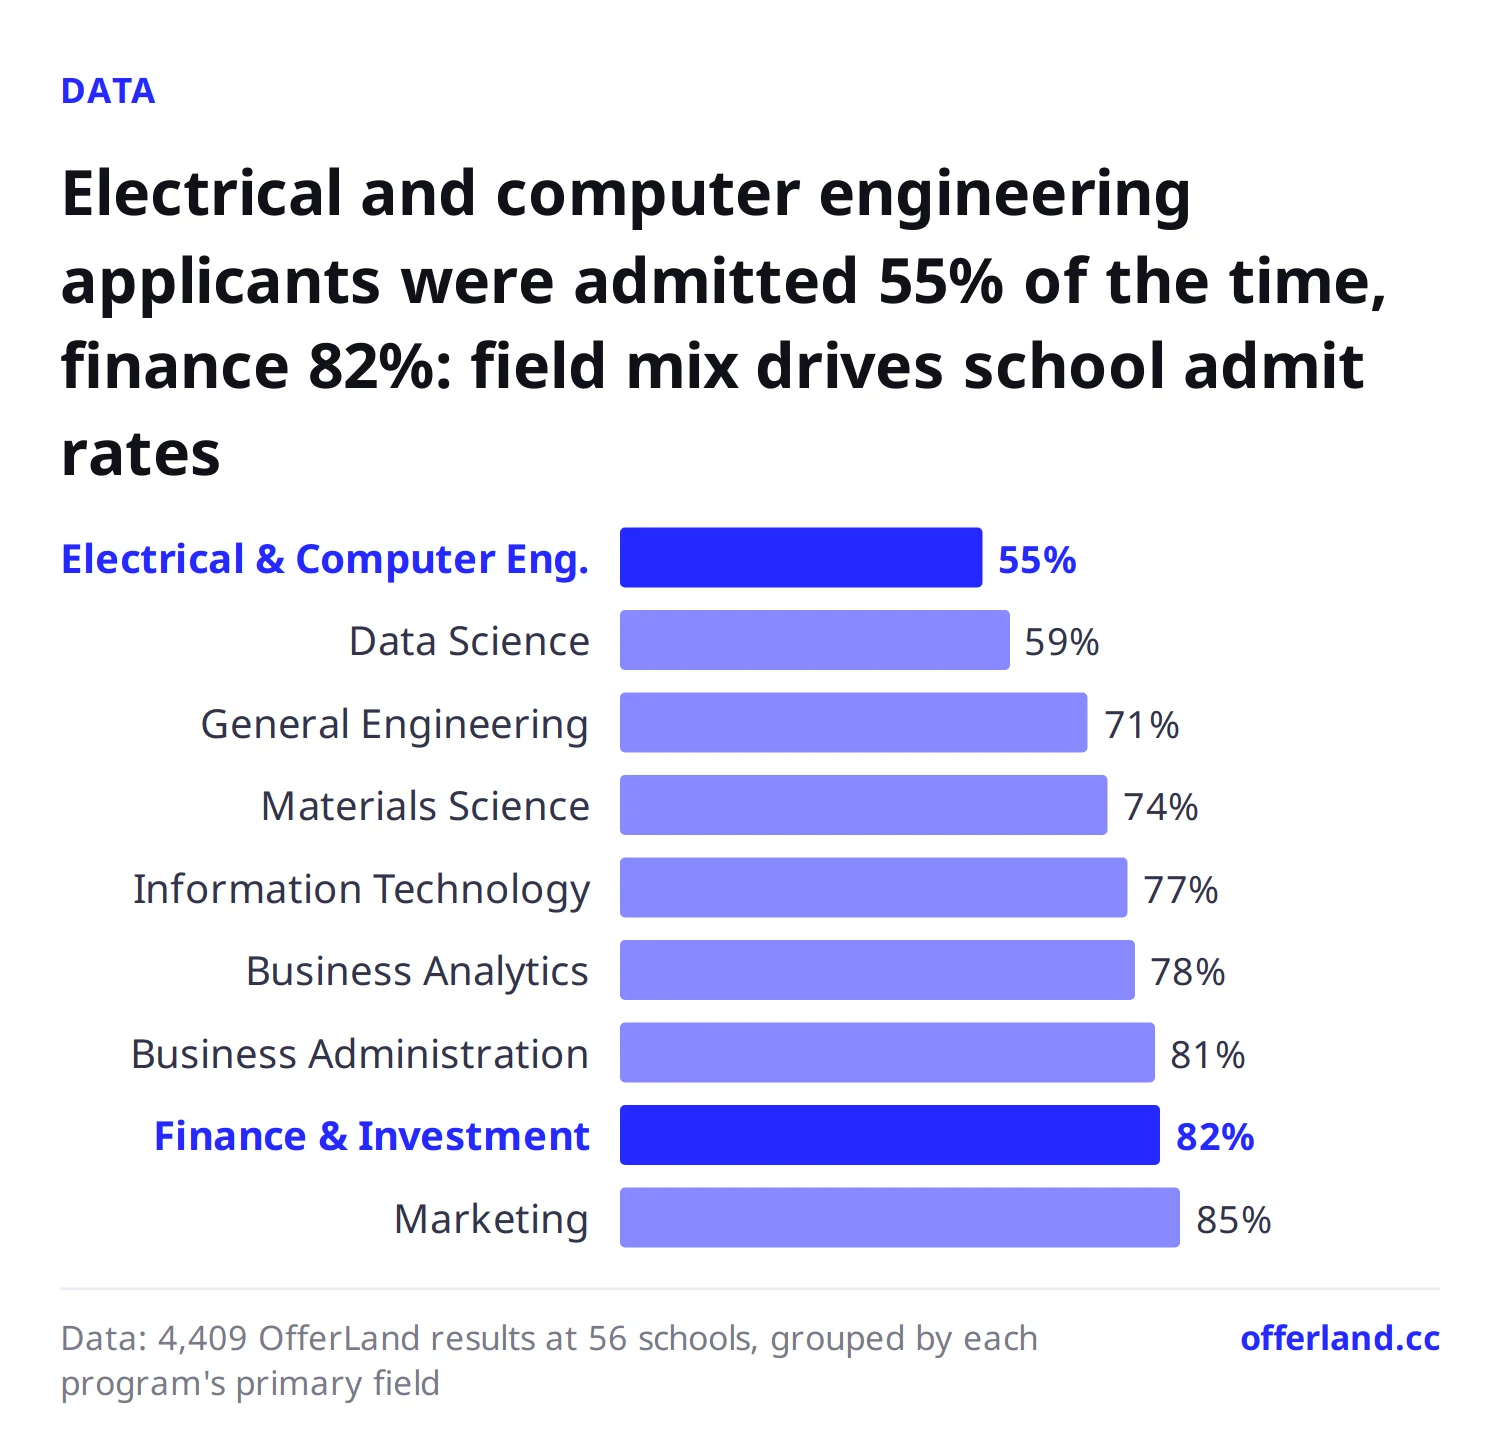
Field (these 56 schools) | Results | Admit rate |
|---|---|---|
Electrical Engineering and Computer Science | 1,431 | 55% |
Data Science | 117 | 59% |
General Engineering | 405 | 71% |
Materials Science | 219 | 74% |
Information Technology | 179 | 77% |
Business Analytics | 338 | 78% |
Business Administration | 311 | 81% |
Finance and Investment | 363 | 82% |
Marketing | 170 | 85% |
Degree level matters too: these 56 schools have 345 PhD results with a 46% admit rate, versus 71% for 4,010 master's results. At Stanford, 55% of results are EECS and 22% are PhD; at MIT, 58% are PhD, which naturally pushes their admit rates down.
There's also reporting bias. People who come back to report results are often the ones who got in; rejected applicants are more likely to skip reporting altogether. For example, all 27 results for UIUC's Master of Science in Finance (MSF) on the site are admits, which more likely reflects reporting bias than everyone actually being admitted. So schools with high admit rates may not be as easy to get into as they look.
Same school, very different programs
Looking only at a school's admit rate is easy to misread. Below are three schools with two or more programs that each have 10 or more results; programs at the same school differ by 50 to 80 percentage points.
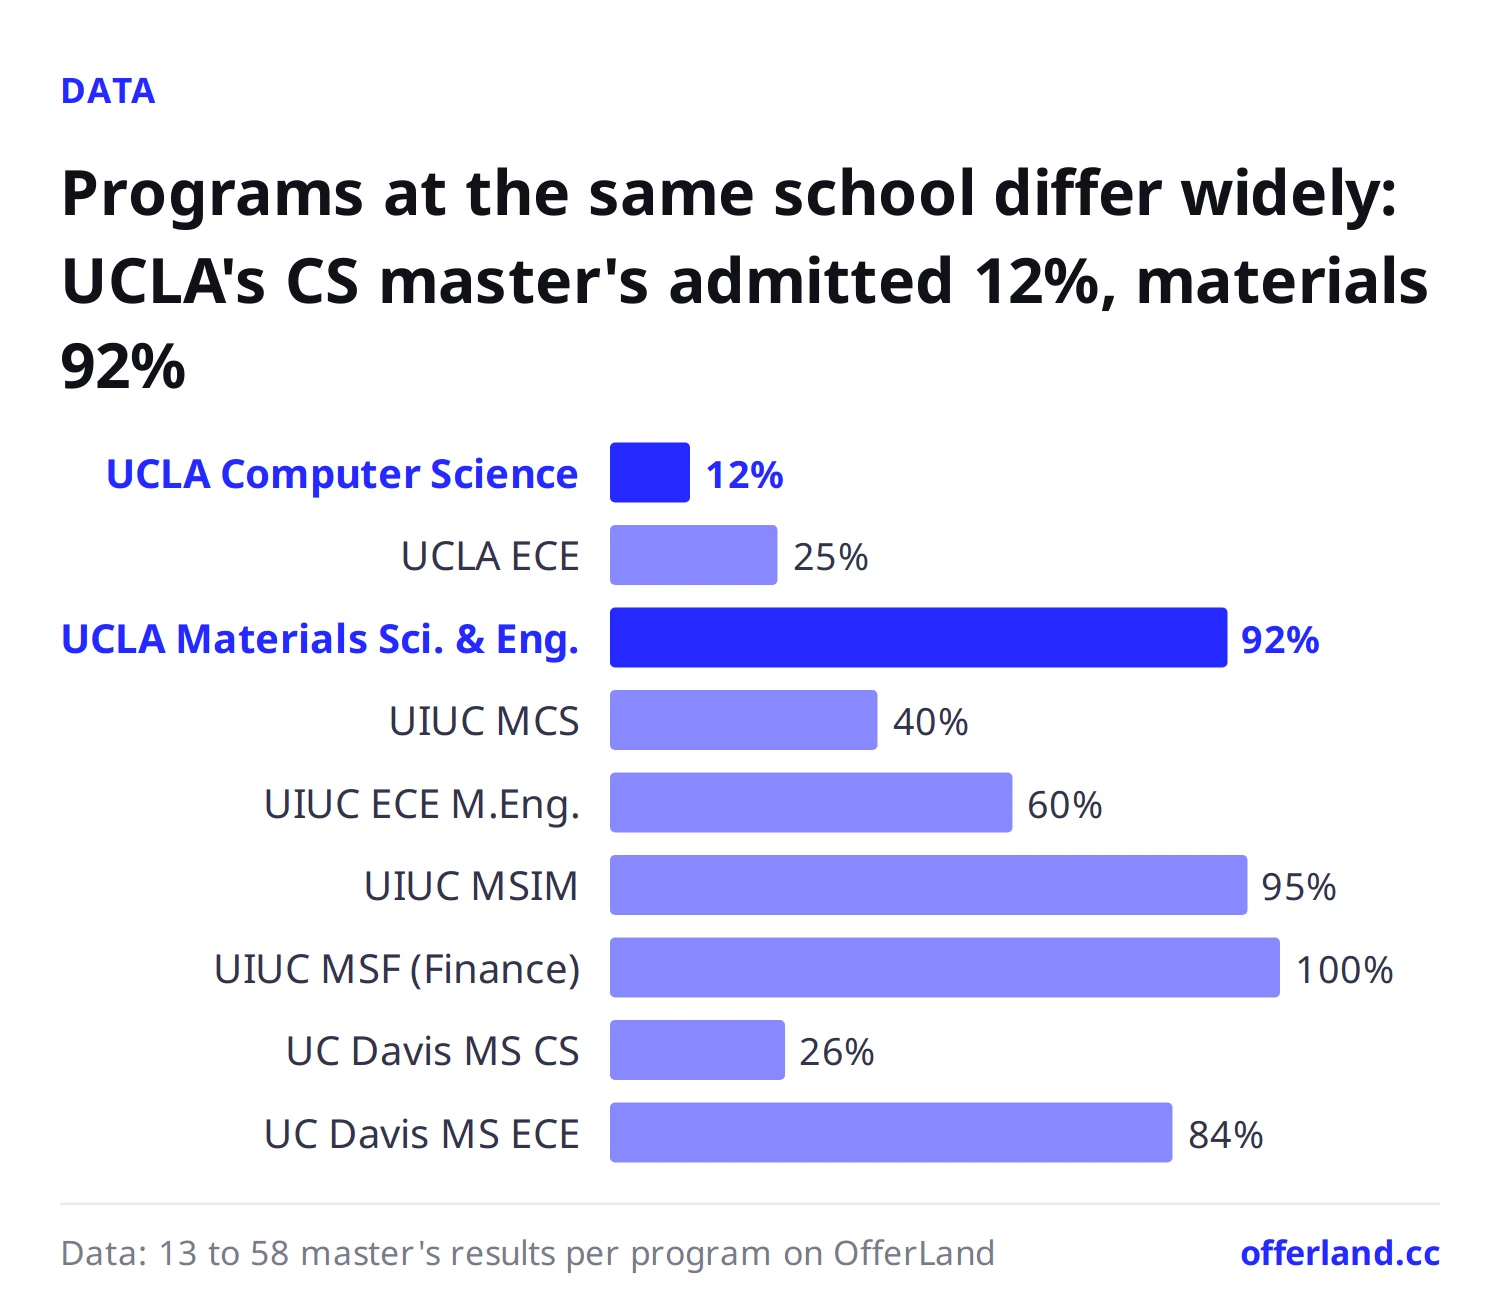
School | Program (master's) | Results | Admit rate | Median admitted GPA (people) |
|---|---|---|---|---|
UCLA | 26 | 12% | Not enough data | |
UCLA | 20 | 25% | 3.90 (5) | |
UCLA | 13 | 92% | 3.67 (11) | |
UIUC | 58 | 40% | 3.81 (21) | |
UIUC | 35 | 60% | 3.67 (21) | |
UIUC | 21 | 95% | 3.59 (17) | |
UIUC | 27 | 100% | 3.58 (23) | |
UC Davis | 19 | 26% | Not enough data | |
UC Davis | 19 | 84% | 3.53 (13) |
UCLA's overall admit rate is 50%, but only 3 of 26 CS master's results were admits, while 12 of 13 materials master's results were. At UIUC, the median admitted GPA is 3.81 for the CS M.C.S. and 3.58 for the Finance MSF: same school, but the bar for the two programs looks very different. UC Davis is 59% overall, but only 26% for its CS master's and 84% for its ECE master's.
A school's admit rate lumps together applicants to CS, materials and finance, so using it to choose schools can easily mislead you. EECS master's programs are covered in detail in a separate column; here, just one caution: a CS applicant who sees UCLA's "50%" may actually be facing 12%.
How to use these numbers
Look at the program, not just the school. Start by finding the program you're applying to on the school page, and use its admit rate only if it has 10 or more results; if the sample is too small, look at the same field at other schools. Overall numbers for each field are in admissions data by field.
Use the admit rate tables as a reference, not as a verdict on school quality. A low admit rate means "people who reported on the site got rejected here more often," not a quality score. Imperial (QS 2) is at 57% and Georgia Tech (QS 142) at 35%; the two don't track the rankings.
If you're applying in EECS, adjust the table's admit rates downward. The EECS admit rate across these 56 schools is 55%, 14 percentage points below the overall 69%. When splitting your list into reach, target and safety schools, be a bit more conservative than business applicants.
If you're applying in business, don't be fooled by high admit rates. On-site admit rates for finance, marketing and business analytics are all above 78%, but reporting bias may be stronger in these programs, and one or two rejections can move the numbers a lot.
Compare against admitted GPAs. Every school above lists the median GPA of admitted applicants, so you can see where you stand. To see the full profiles of admitted applicants for a specific school and program, filter in the admission results search; overall data for the US and UK is on the US and UK country pages.
FAQ
Which school has the lowest graduate admit rate?
Among schools with 30 or more results on OfferLand, Stanford has the lowest admit rate: 14% across 69 results, and only 9% across 53 master's results. Next are MIT at 29%, UC Berkeley at 31% and Georgia Tech at 35%.
Are schools with low admit rates always better?
Not necessarily. At the 15 schools with the lowest on-site admit rates, 35% of applications were in Electrical Engineering and Computer Science, a field whose admit rate is only 55% to begin with; at the 15 highest, business applications made up 54%. Admit rates reflect who applies and how people report, not school quality.
Is it easier to get into grad school in the UK than in the US?
7 of the 15 schools with the highest on-site admit rates are in the UK, including King's College London at 92% and the University of Manchester at 88%. But UCL, Imperial and LSE in London are all at just 57%–58%, and UK results are mostly business master's programs, so they can't be compared directly with the US.
Can admit rates differ a lot between programs at the same school?
Yes. UCLA's CS master's had a 12% admit rate across 26 results, while its materials master's was 92% across 13; at UIUC, the CS M.C.S. is 40% and the Finance MSF is 100%. Check the program's numbers before applying, not just the school's.
Data methodology
Source: OfferLand's own sample, self-reported by users; not official school data. Most of the site's users are Taiwanese students.
Sample: result dates from June 2011 to September 2026, excluding deleted accounts. Only schools with at least 30 admit + reject results are listed: 56 schools, 4,409 results, 1,238 applicants. Under the same criteria the whole site has 271 schools and 5,545 results, with an overall admit rate of 71%.
Admit rate: (admit + decision) ÷ (admit + decision + reject). "Decision" means admitted and chose to enroll, which also counts as an admit. Waitlisted and pending results are excluded from the denominator; there are 33 at these 56 schools.
Master's admit rate: counts only results with the degree Masters; MBA is counted separately and is not in this column.
GPA: converted to a 4.0 scale (GPA ÷ maximum × 4), dropping values above 4.3 after conversion; each admitted applicant counts once per school. Medians use percentile_cont(0.5); fewer than 5 people is shown as "Not enough data."
Fields: each program's primary field (is_primary in major_field_v2). Business = Business Analytics, Finance and Investment, Marketing, Business Administration.
Ranking: QS 2027.
Data as of: October 19, 2026.
OfferLand editorial team · Jason · Last updated 2026-11-12 · About the editorial team
See which schools admitted applicants with a background like yours
Search resultsSchools in this post
- University of California, Los Angeles (UCLA)
- University of Illinois at Urbana-Champaign (UIUC)
- Massachusetts Institute of Technology (MIT)
- Georgia Institute of Technology
- Stanford University
- The University of Manchester
See each school's applicant numbers, admit rates and past applicants' results
See admission data for these schools