Translated by OfferLand from the original Traditional Chinese post. View original

OfferLand
Updated Oct 19
Switching Fields for Grad School: Is the Admit Rate Really Lower?
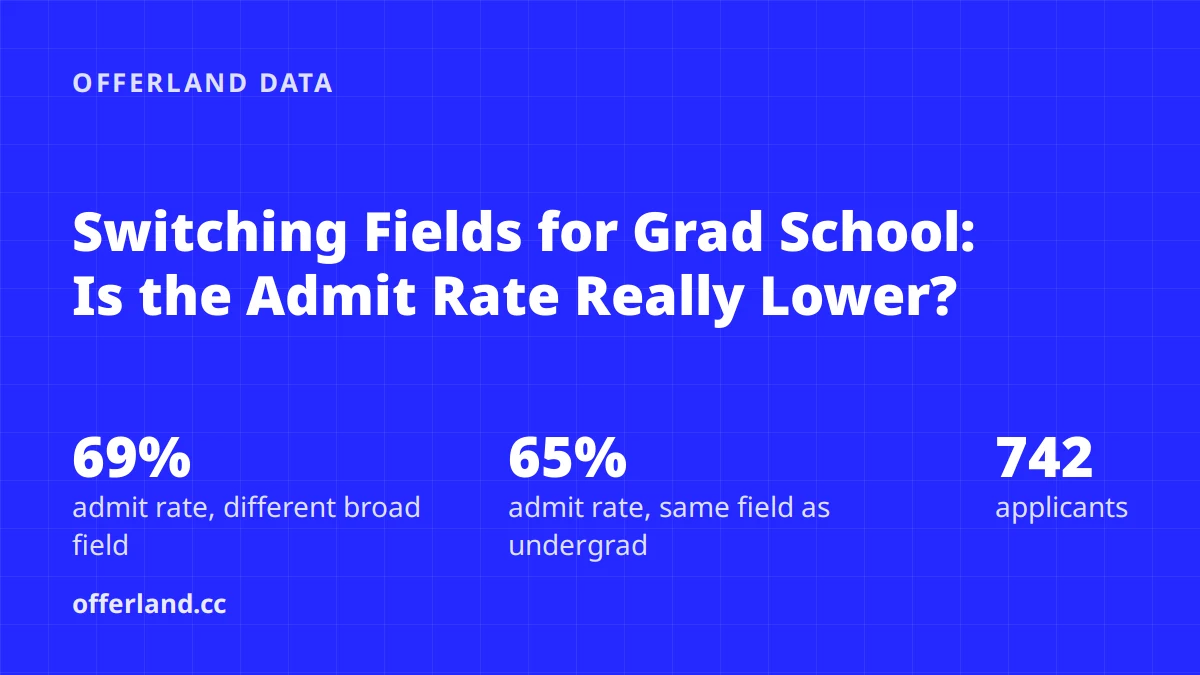
Applying to grad school in a different field doesn't come with a lower admit rate. Among 742 OfferLand applicants who listed their undergraduate major, applications to a different broad area had a 69% admit rate, versus 65% for applications in their own field; at US schools alone, both are 61%. The real differences are in the specific path: business administration majors moving into marketing and finance majors moving into business administration both exceed 85%, while economics or math majors moving into EE/CS are only around 40%.
Key takeaways
Of the 742 applicants, 566 (76%) applied to at least one program in a field different from their undergraduate major. Applicants who applied only within their own field are the minority.
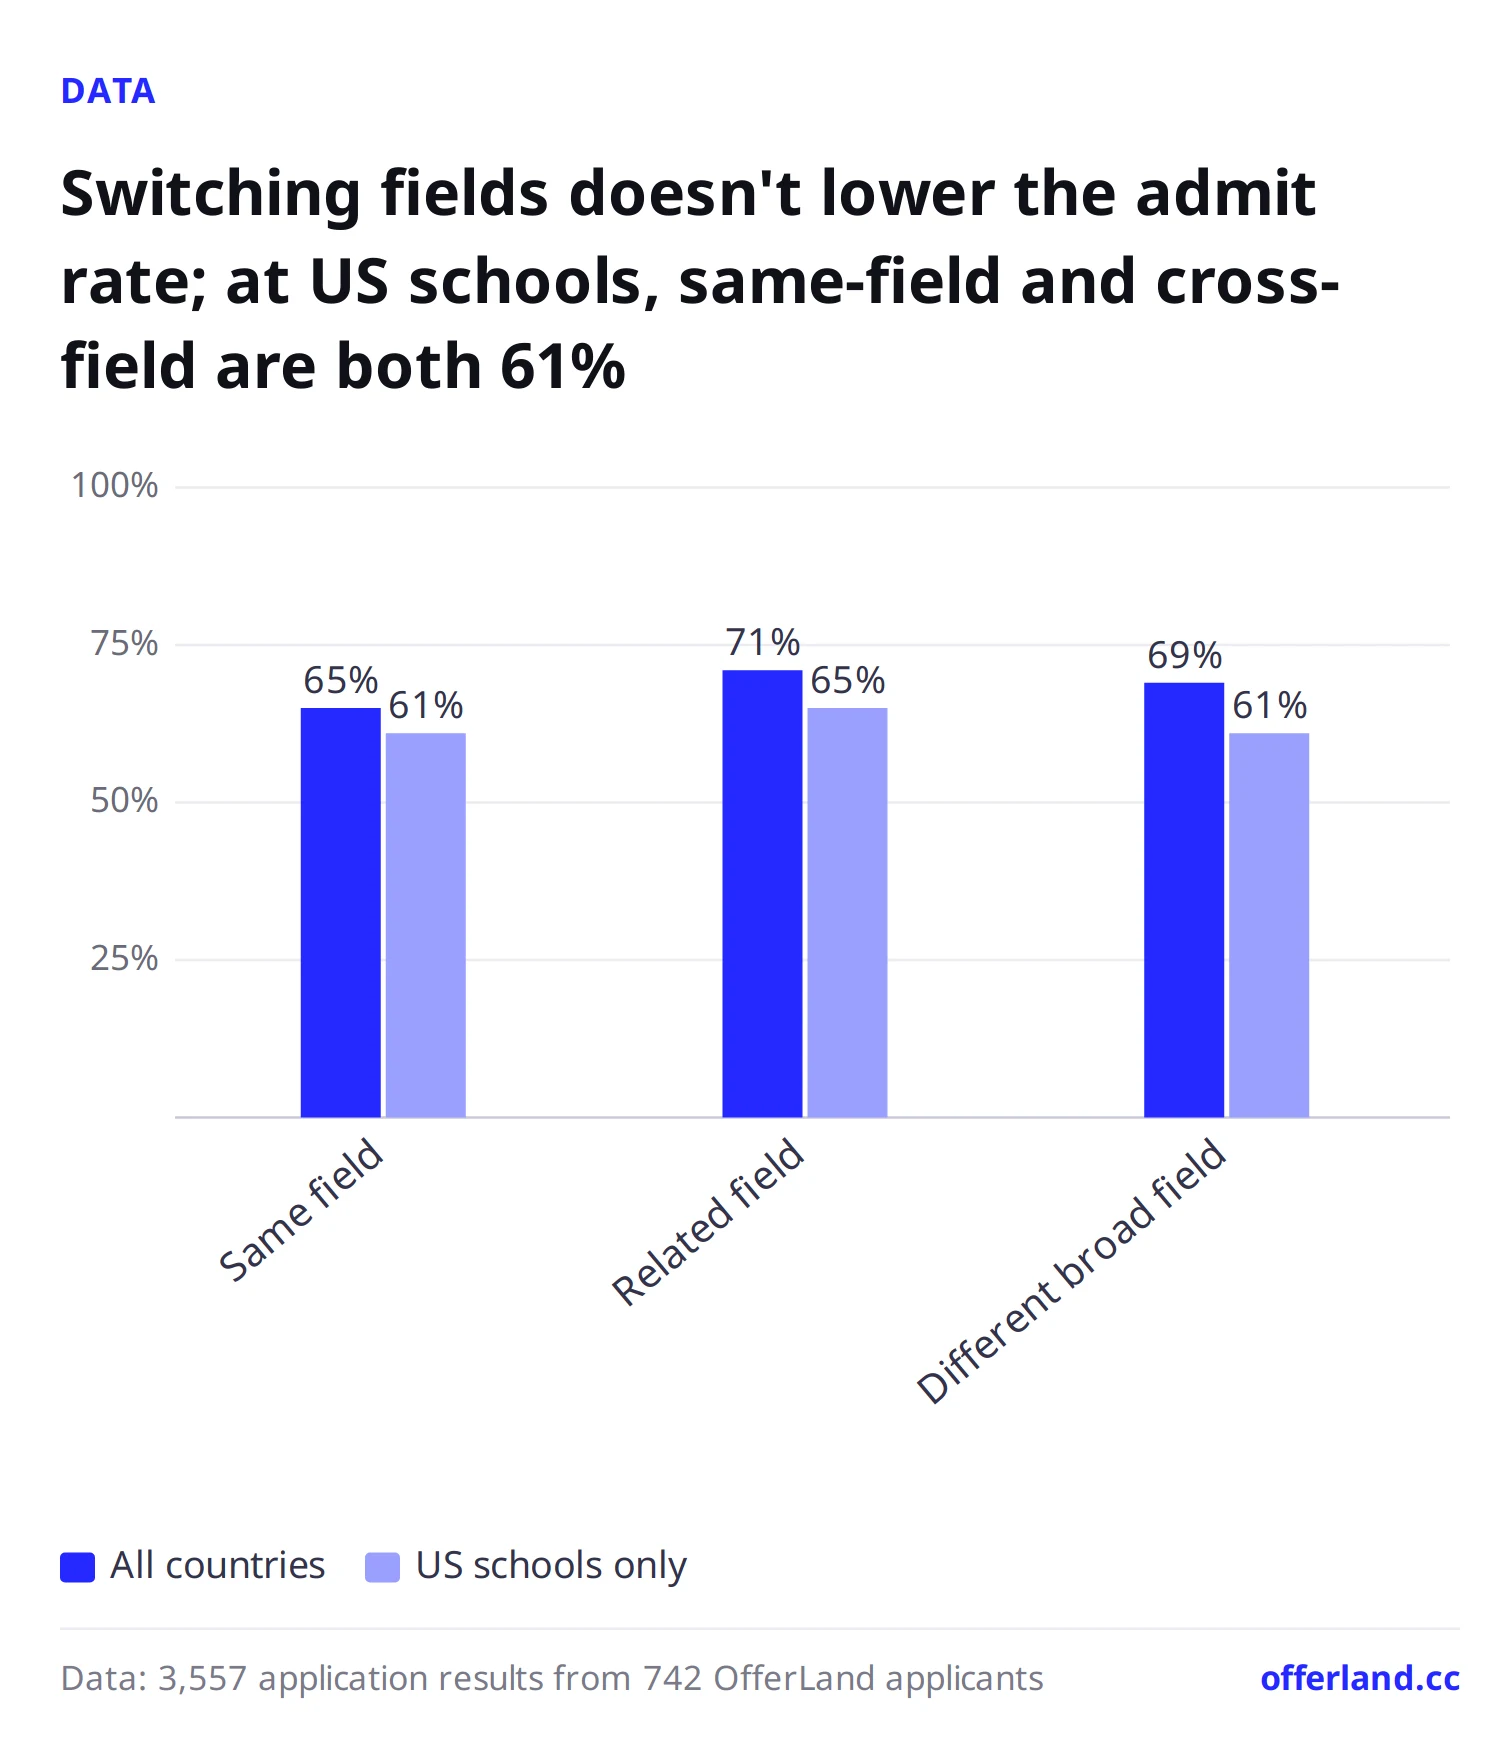
Among applications with a result, same-field applications number 1,414 with a 65% admit rate; switching fields within the same broad area (for example, business to business analytics) 881, 71%; and switching to a different broad area 1,262, 69%.
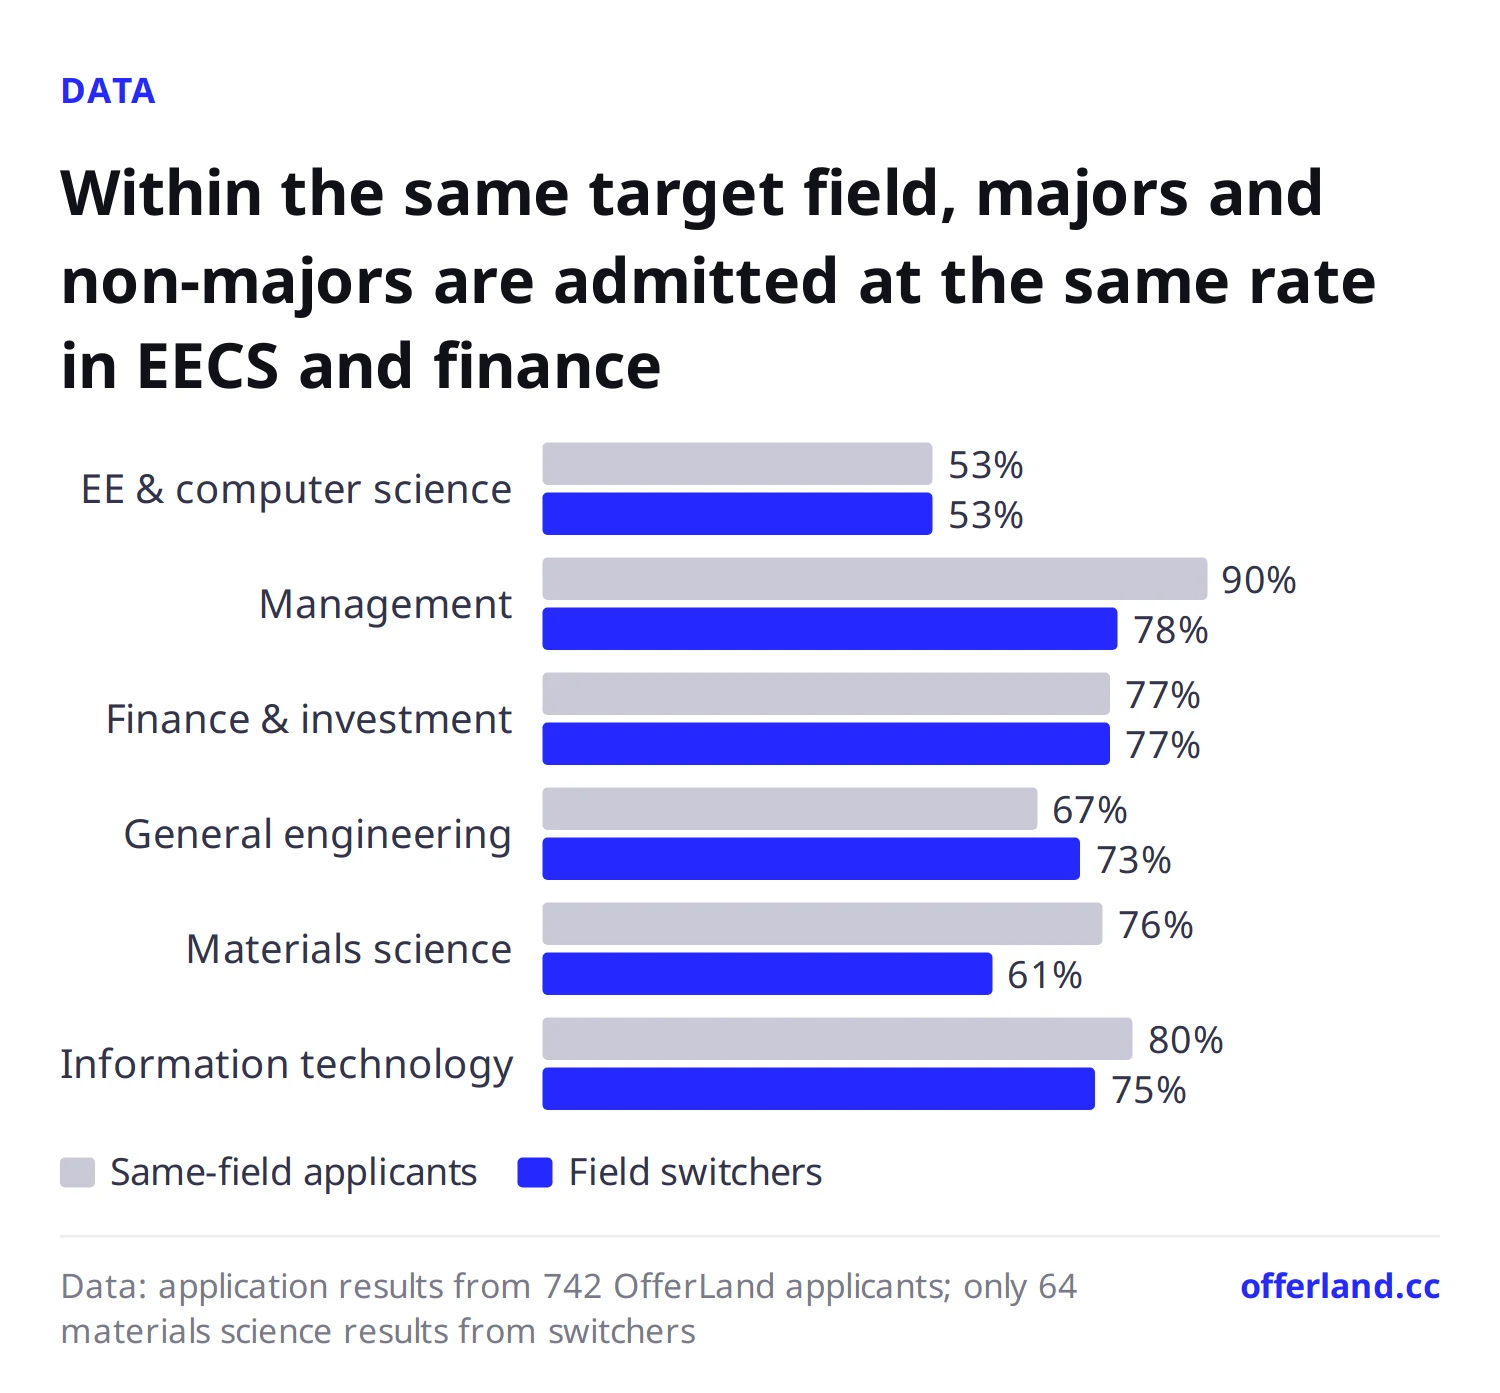
Within the same target field, in-field and out-of-field applicants to EE/CS master's programs both have a 53% admit rate; for business administration programs, in-field applicants are at 90% and out-of-field applicants at 78%.
EE majors applied to CS master's programs 204 times, with a 56% admit rate and an admitted median GPA of 3.61 (20 people).
Applicants with EE/CS, engineering or science backgrounds applied to business programs 69 times, with a 91% admit rate and an admitted median GPA of 3.65 (13 people).
Admit rates for switching fields: no lower than staying in your field overall
This column maps both undergraduate majors and target programs to the site's field categories (the same ones used in admissions data by field), then splits applications into three cases:
Same field: the target field matches the undergraduate major, e.g. a finance major applying to a finance master's.
New field, same broad area: switching fields within one broad area, e.g. a business administration major applying to business analytics, or a mechanical engineering major applying to EE/CS.
Different broad area: e.g. an economics major applying to CS, or a foreign languages major applying to marketing.
The admit rates of the three cases are close, and admitted applicants who switched fields actually have a slightly higher median GPA.
Application type | Results | Admits | Admit rate | Applicants | Admitted GPA, median (25th–75th percentile) |
|---|---|---|---|---|---|
Same field | 1,414 | 922 | 65% | 339 | 3.60 (141 people, 3.40–3.83) |
New field, same broad area | 881 | 628 | 71% | 282 | 3.65 (109 people, 3.37–3.86) |
Different broad area | 1,262 | 874 | 69% | 366 | 3.70 (153 people, 3.50–3.90) |
The same person may apply to both same-field and different-field programs, so the applicant counts add up to more than 742.
Same-field applications look like they have the lowest admit rate mainly because 570 of them are EE/CS majors applying to EE/CS master's programs, a group with only a 53% admit rate. Among the fields with the most applications, EE/CS has the lowest admit rate, which pulls the overall average down.
Country also affects the comparison. A third of different-broad-area applications went to the UK (421 results), and UK admit rates are higher than US ones to begin with. By country:
Country | Same field | New field, same broad area | Different broad area |
|---|---|---|---|
United States | 61% (1,104 results) | 65% (550 results) | 61% (715 results) |
United Kingdom | 82% (233 results) | 77% (248 results) | 80% (421 results) |
At US schools alone, same-field and different-broad-area applications have the same admit rate. At QS 2027 top-50 schools, same-field applications are at 54% (376 results) and different-broad-area applications at 62% (407 results); again, the gap comes mainly from EE/CS.
PhD programs are the exception. Different-broad-area PhD applications number 97, with a 35% admit rate; same-field PhD applications number 136, with 43%. PhD programs usually value relevant research experience, which may be why switching fields shows a larger gap there.
Within the same field: do in-field applicants have an edge?
Fixing the target field and comparing in-field with out-of-field applicants shows more clearly whether departments care about background.
Target field | In-field results | In-field admit rate | Out-of-field results | Out-of-field admit rate |
|---|---|---|---|---|
Electrical Engineering and Computer Science | 570 | 53% | 388 | 53% |
Business Administration | 88 | 90% | 273 | 78% |
Finance and Investment | 120 | 77% | 178 | 77% |
General Engineering | 215 | 67% | 78 | 73% |
Materials Science | 139 | 76% | 64 | 61% |
Information Technology | 60 | 80% | 102 | 75% |
In EE/CS and finance, in-field and out-of-field applicants have exactly the same admit rate. Materials science shows a 15-point gap, but there are only 64 out-of-field results, so treat it as a rough figure.
Some fields have almost no "in-field applicants" in the sample, because few people major in them as undergraduates. Business analytics has 286 out-of-field applications with a 76% admit rate; marketing 151, 88%; data science 112, 61%; and human resources 80, 90%. Applicants to these programs come from all kinds of backgrounds.
The most common field-switching paths
Below are the field-switching paths with the most applications and at least 5 applicants. Admitted GPA counts only the 4.0 scale; fewer than 5 people is marked "Too few results".
Undergraduate major → target field | Results | Applicants | Admit rate | Admitted GPA (median) |
|---|---|---|---|---|
Mechanical, chemical and other engineering → EE/CS | 152 | 34 | 55% | 3.81 (10 people) |
Business administration → business analytics | 70 | 26 | 61% | 3.74 (12 people) |
Information management → EE/CS | 60 | 14 | 65% | 3.60 (8 people) |
Economics → finance | 57 | 21 | 74% | 3.51 (7 people) |
Business administration → marketing | 56 | 16 | 86% | 3.65 (10 people) |
Business administration → finance | 54 | 16 | 83% | 3.80 (8 people) |
Math, statistics → EE/CS | 49 | 10 | 39% | Too few results |
Economics → business administration | 43 | 16 | 63% | Too few results |
Economics → EE/CS | 42 | 7 | 40% | Too few results |
Foreign languages → marketing | 42 | 14 | 81% | 3.70 (7 people) |
International business → business administration | 41 | 15 | 63% | 3.56 (8 people) |
Finance → business administration | 39 | 25 | 87% | 3.68 (13 people) |
Economics → data science | 39 | 8 | 44% | Too few results |
International business → business analytics | 37 | 10 | 84% | 3.60 (7 people) |
Accounting → business analytics | 36 | 12 | 61% | Too few results |
Finance → business analytics | 32 | 11 | 94% | 3.90 (5 people) |
Math, statistics → data science | 22 | 12 | 73% | 3.76 (8 people) |
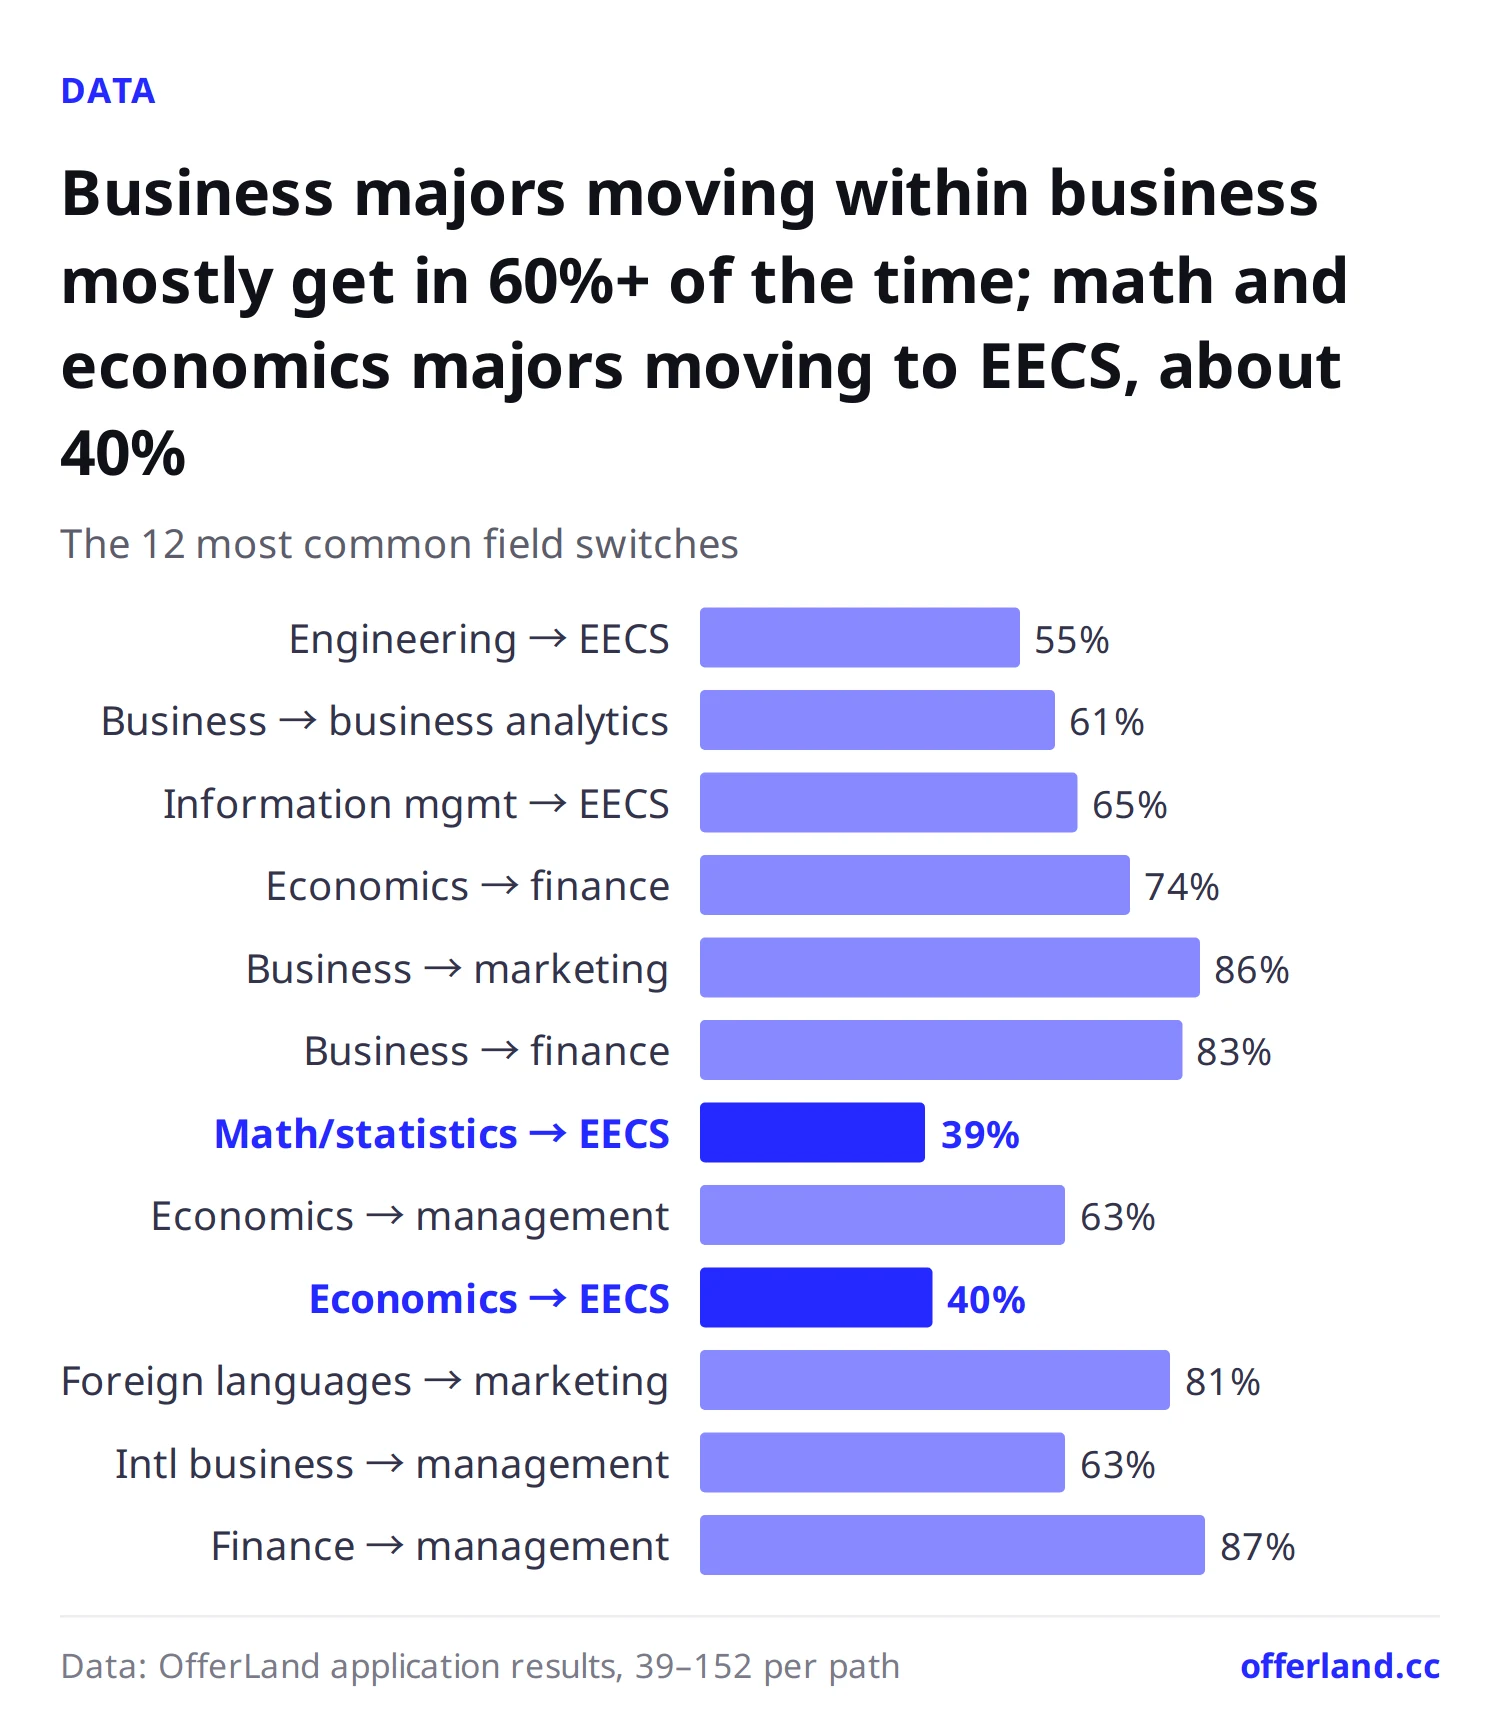
Business majors moving into other business programs mostly have admit rates above 60%. The harder move is from a non-EE/CS background into EE/CS: 55% from engineering, 39% from math and statistics, and 40% from economics. Admitted engineering-to-EE/CS applicants have a median GPA of 3.81, higher than the 3.65 (35 people) of admitted in-field EE/CS applicants. People who moved from mechanical or chemical engineering into CS and got in generally had better grades than in-field applicants.
EE to CS
EE and CS are a single field on the site, so here they are split again by program name. EE majors applying to CS master's programs actually have a higher admit rate than CS majors:
Undergraduate major → target program | Results | Applicants | Admit rate | QS top-50 admit rate |
|---|---|---|---|---|
EE → CS | 204 | 46 | 56% | 24% (29 results) |
CS → CS | 281 | 42 | 49% | 33% (64 results) |
EE → EE | 68 | 31 | 65% | Too few results |
Admitted EE-to-CS applicants have a median GPA of 3.61 (20 people, 3.38–3.72), versus 3.84 (13 people) for admitted CS majors. CS majors sent 23% of their applications to the QS top 50, compared with only 14% for EE majors, which may be one reason CS majors have a lower overall admit rate. At the QS top 50 alone, CS majors are at 33%, higher than EE majors' 24%.
STEM to business
29 applicants with EE/CS, engineering or science backgrounds applied to business programs 69 times, with a 91% admit rate. That includes business analytics at 32 results, 91%; business administration at 19 results, 89%; and finance at 17 results, 94% (only 6 people). The admitted median GPA is 3.65 (13 people). The sample is small, but the direction is consistent: in this data, STEM applicants moving into business are rarely rejected.
Humanities and social sciences to business
Applicants with backgrounds in foreign languages, communications, education, design, social sciences and similar fields applied to business programs (excluding finance and business analytics) 223 times across 70 people, with an 87% admit rate and an admitted median GPA of 3.70 (29 people). Of those, 124 (56%) were at UK schools, also with an 87% admit rate. The two fields foreign languages majors applied to most were marketing (42 results) and business administration (27 results).
Where out-of-field applicants apply
Of the 10 schools with the most reported results from out-of-field applications (new field in the same broad area plus different broad area), 6 are in the UK:
School | QS 2027 | Out-of-field results | Admit rate |
|---|---|---|---|
40 | 75 | 87% | |
37 | 61 | 90% | |
172 | 55 | 93% | |
USC | 153 | 65 | 68% |
74 | 56 | 70% | |
68 | 47 | 81% | |
55 | 60 | 63% | |
8 | 65 | 52% | |
35 | 43 | 79% | |
85 | 35 | 94% |
These admit rates mix different programs, so use them only as a rough guide. UCL and CMU have lower out-of-field admit rates, while Manchester, KCL and Durham are all above 85%.
How to use this data
Check your target program's prerequisites first. EE/CS and data science programs usually expect courses in programming, data structures, linear algebra and probability. Math and economics majors moving into EE/CS have an admit rate of only about 40%, so before applying you can fill those gaps by taking courses, earning certificates or doing projects.
Moving into EE/CS takes stronger grades. Admitted engineering-to-EE/CS applicants have a median GPA of 3.81, higher than admitted in-field EE/CS applicants. If your GPA is below 3.6 and you want to move into CS, add a few more schools outside the QS top 100 to your list.
Switching within business is relatively easy, but tier the top schools. Business administration to business analytics is 61% overall but only 41% at the QS top 50 (22 results). Business analytics programs weigh math and programming skills heavily, so list any statistics, Python or SQL courses on your résumé.
Use your documents to explain the switch. Applicants changing fields should explain in their SOP why they are switching and which skills they have already built. The site doesn't have enough data on this, so take it as general advice.
Find people with your background in the admission results search. Go to the admission results search, filter by your target schools and programs, and look at admitted applicants' undergraduate majors and grades.
GPA affects in-field and out-of-field applicants about equally. With a GPA of 3.7 or higher, same-field applications are at 76% (262 results) and out-of-field at 73% (469 results); at 3.4 or below, same-field is at 63% (146 results) and out-of-field at 69% (182 results). A separate column covers how much GPA is enough.
FAQ
Is the admit rate lower when you apply to grad school in a different field?
Not overall. In OfferLand's sample, applications to a different broad area have a 69% admit rate and same-field applications 65%; at US schools alone, both are 61%. The difference lies mainly in the path: moving into EE/CS from a non-EE/CS background has a noticeably lower admit rate.
Can you apply to a CS master's without a CS background?
Yes, but it's harder. Engineering majors moving into EE/CS have a 55% admit rate, math and statistics majors 39% and economics majors 40%, compared with 53% for in-field EE/CS applicants. Admitted engineering-to-EE/CS applicants have a median GPA of 3.81, higher than admitted in-field applicants.
Are EE majors at a disadvantage when applying to CS master's programs?
The site's data shows no disadvantage. EE majors applied to CS master's programs 204 times with a 56% admit rate, versus 49% for CS majors; but at QS top-50 schools alone, CS majors are at 33% and EE majors at 24%.
Can STEM majors switch to business analytics or finance?
Yes. Applicants with EE/CS, engineering or science backgrounds applied to business programs 69 times, with a 91% admit rate and an admitted median GPA of 3.65. In your application documents, you can emphasize your math and programming skills.
Which master's programs suit humanities and social sciences backgrounds?
On the site, applicants with humanities and social sciences backgrounds (foreign languages, communications, education, design, social sciences, etc.) applying to business programs such as business administration, marketing and HR have an 87% admit rate, with more than half of those at UK schools. Foreign languages majors applying to marketing have an 81% admit rate.
Data methodology
Sample: 742 OfferLand users who listed an undergraduate major in their profile, have not deleted their account, and reported master's, PhD or MBA application results, for a total of 3,557 applications with a result (admit or rejection). About 756 users listed a major and reported results; after removing undergraduate applications and majors that couldn't be classified, 742 remain. Most users did not list an undergraduate major, so this data represents only part of all applicants.
Timing: result dates are mostly from 2023–2024 (over 70%). Data as of October 18, 2026.
Undergraduate major classification: the major names users entered were manually mapped to the site's field categories for this column. For example, Business Administration went to "Business Administration", Information Management to "Information Technology", and mechanical, civil, chemical and industrial engineering to "General Engineering". The few names that couldn't be classified (such as undeclared programs) were left out. Target programs use each program's primary field on the site.
Admit rate = (admit + decision) ÷ (admit + decision + reject); waitlist and pending are left out. The definition matches the data methodology page.
GPA uses only 4.0-scale values between 0 and 4, counted once per admitted applicant. Cells with fewer than 5 people or 5 results are marked "Too few results" or not shown.
Rankings are QS 2027.
This is correlational data and does not mean that switching fields itself raises or lowers your chances. People willing to apply across fields may simply have been better prepared to begin with.
These are statistics from OfferLand's own sample, self-reported by users, not official school data. For more overall data, see the 2026 admissions report.
OfferLand editorial team · Jason · Last updated 2026-11-03 · About the editorial team
See which schools admitted applicants with a background like yours
Search resultsSchools in this post
- Carnegie Mellon University (CMU)
- King's College London (KCL)
- Arizona State University (ASU)
- University College London (UCL)
- University of Illinois at Urbana-Champaign (UIUC)
- The University of Manchester
See each school's applicant numbers, admit rates and past applicants' results
See admission data for these schools