Translated by OfferLand from the original Traditional Chinese post. View original

OfferLand
Nov 5
How Many Grad Schools Should You Apply To? Data from 553 Applicants
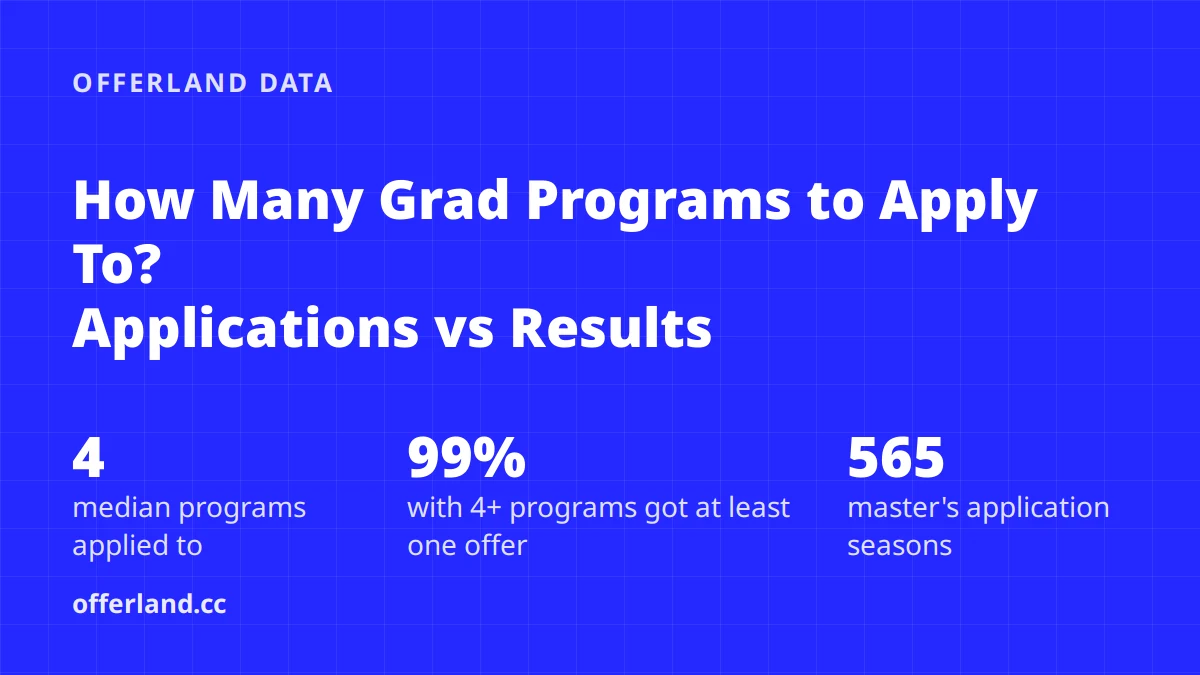
How many grad programs should you apply to? Among master's applicants on OfferLand over the last three application cycles, the median number of programs reported was 4 (the middle 50% reported 2 to 6), and 99% of those who applied to 4 or more got at least one offer. The more programs people applied to, though, the lower their per-program admit rate: 85% for those applying to 2 to 3, and only 53% for those applying to 8 or more. So for most people, 4 to 6 programs spread across tiers is enough; piling on more applications adds little.
Key takeaways
Across 565 master's application cycles since September 2023, the median applicant reported 4 programs at 3 schools.
548 of the 565 cycles (97%) ended with at least one offer; of the 17 with no offers, 11 reported only 1 program.
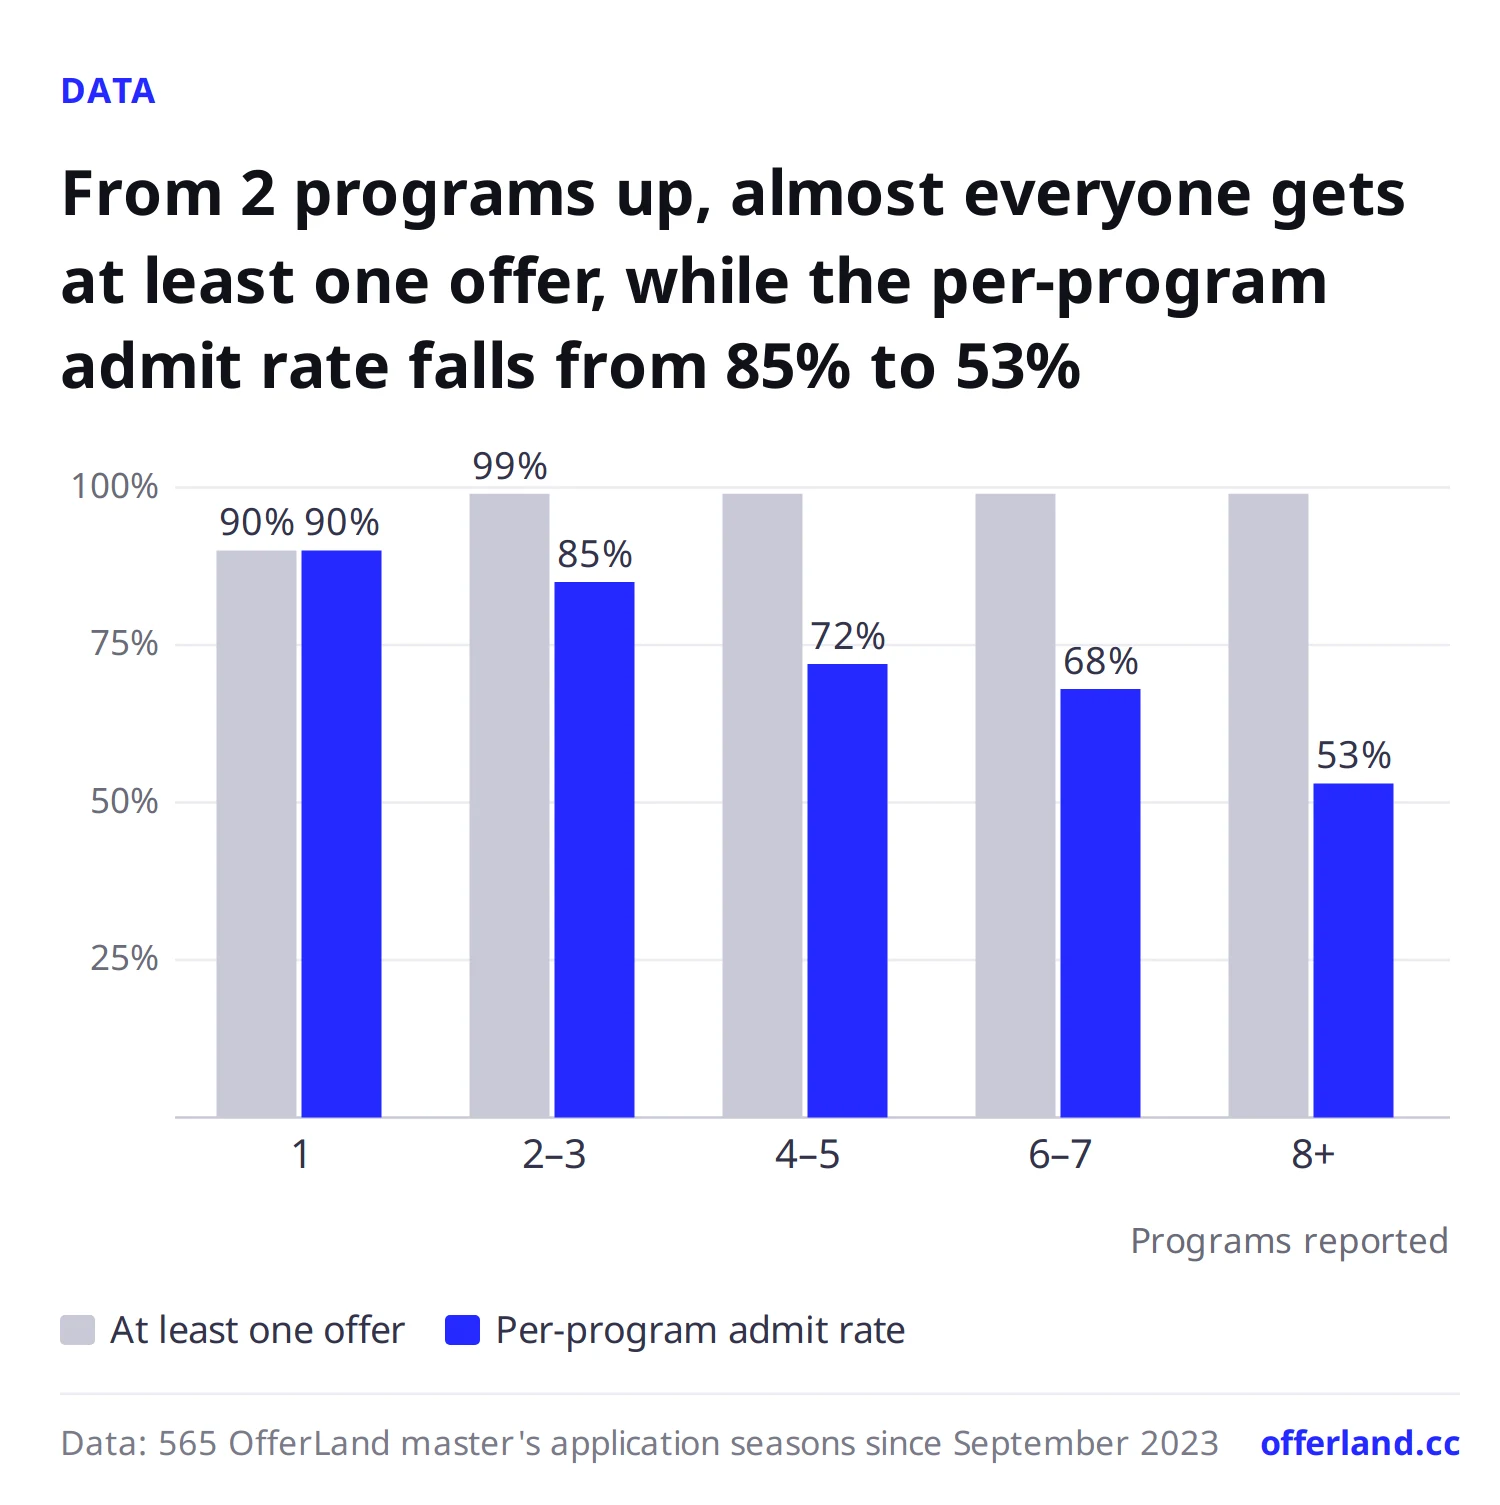
Per-program admit rates drop as the number of applications rises: 85% for 2 to 3, 72% for 4 to 5, and 53% for 8 or more.
Admitted applicants' median GPA sits between 3.70 and 3.81 in every bracket, so people who apply more widely are neither "stronger" nor "weaker."
Applicants focused on the QS top 50 had a 69% per-program admit rate versus 67% for everyone else, a small gap; admitted applicants' median GPA was 3.80 versus 3.70.
First, reporting bias: older data mostly lists offers only
Many people report only the offers they get and don't log every rejection. The table below splits the data into three periods by application cycle, and the shares who "reported only 1 program" and who "reported at least one rejection" differ a lot.
Application cycle | Cycles | Reported only 1 program | Reported a rejection | Median programs |
|---|---|---|---|---|
2019 and earlier | 79 | 63% | 1% | 1 |
2020–2023 | 878 | 53% | 21% | 1 |
2024 onward | 565 | 19% | 52% | 4 |
From the 2024 cycle on, reporting is more complete: more than half of applicants logged their rejections too, so the analysis below focuses on these 565 cycles. Even so, the "at least one offer" share still runs high, because people who were rejected everywhere are less likely to come back and report. Treat it as an upper bound. Below, one application cycle counts as one person; only a few of the 553 people reported two cycles.
How outcomes differ by number of programs
Applicants from the last three cycles are grouped by the number of programs they reported. Once you're at 2 or more, the share with at least one offer is close to 100%; what actually changes is the per-program admit rate.
Programs reported | Cycles | At least one offer | Per-program admit rate | Median offers |
|---|---|---|---|---|
1 | 110 | 90% | 90% | 1 |
2–3 | 163 | 99% | 85% | 2 |
4–5 | 138 | 99% | 72% | 3 |
6–7 | 84 | 99% | 68% | 4.5 |
8 or more | 70 | 99% | 53% | 5.5 |
Total | 565 | 97% | 68% | 3 |
Of the 17 people with no offers, 11 reported only 1 program; of the 455 who reported 2 or more, only 6 came away with nothing.
The falling admit rate doesn't mean applying more makes you unlucky. A likelier reason is that people who apply widely are more willing to log their rejections too. The rankings don't show them choosing harder schools: for those applying to 8 or more, the QS top 50 made up only 23% of their programs, compared with 37% for those applying to 2 to 3. Overall, people applying to 8 or more had a median of 5.5 offers, more than those applying to 4 to 5, but close to half of their results were rejections.
Now look at school tiers. Across 2,390 programs in the last three cycles, schools in the QS 2027 top 50 had a 61% admit rate (708 results), ranks 51 to 100 had 68% (730 results), and schools ranked below 100 had 74% (867 results). That 13-percentage-point gap between the top 50 and schools below 100 is mainly what tiering your school list is meant to handle.
Do people who apply more have higher GPAs?
No. Among the 197 applicants in the last three cycles who reported a GPA on a 4.0 scale and got at least one offer, the median GPA was 3.72, with little difference between brackets.
Programs reported | Admitted applicants with a GPA | Median GPA | Middle 50% |
|---|---|---|---|
1 | 32 | 3.81 | 3.58–3.90 |
2–3 | 60 | 3.72 | 3.52–3.88 |
4–5 | 50 | 3.73 | 3.54–3.89 |
6–7 | 31 | 3.70 | 3.55–3.84 |
8 or more | 24 | 3.71 | 3.38–3.83 |
The number of applications looks more like a personal strategy and has no clear link to GPA. The 25th percentile for the 8-or-more group is lower at 3.38, so some of them may be spreading risk through volume because their GPA is less secure, but the sample is only 24 people, so don't read too much into it. It is also only a correlation and says nothing about cause.
Aiming for the QS top 50: how many top-50 programs to apply to
Applicants from the last three cycles who reported 2 or more programs are split into two groups: "top-50 focused," where more than half of their programs are in the QS top 50, and everyone else.
Group | Cycles | Median programs | At least one offer | Per-program admit rate | Admitted applicants' median GPA (n) |
|---|---|---|---|---|---|
Top-50 focused | 143 | 4 | 97% | 69% | 3.80 (35) |
Others | 312 | 4.5 | 99% | 67% | 3.70 (130) |
The two groups have almost the same per-program admit rate, possibly because top-50-focused applicants have higher GPAs to begin with, offsetting the difficulty of the schools. Top-50-focused applicants are slightly less likely to get at least one offer (97% vs. 99%).
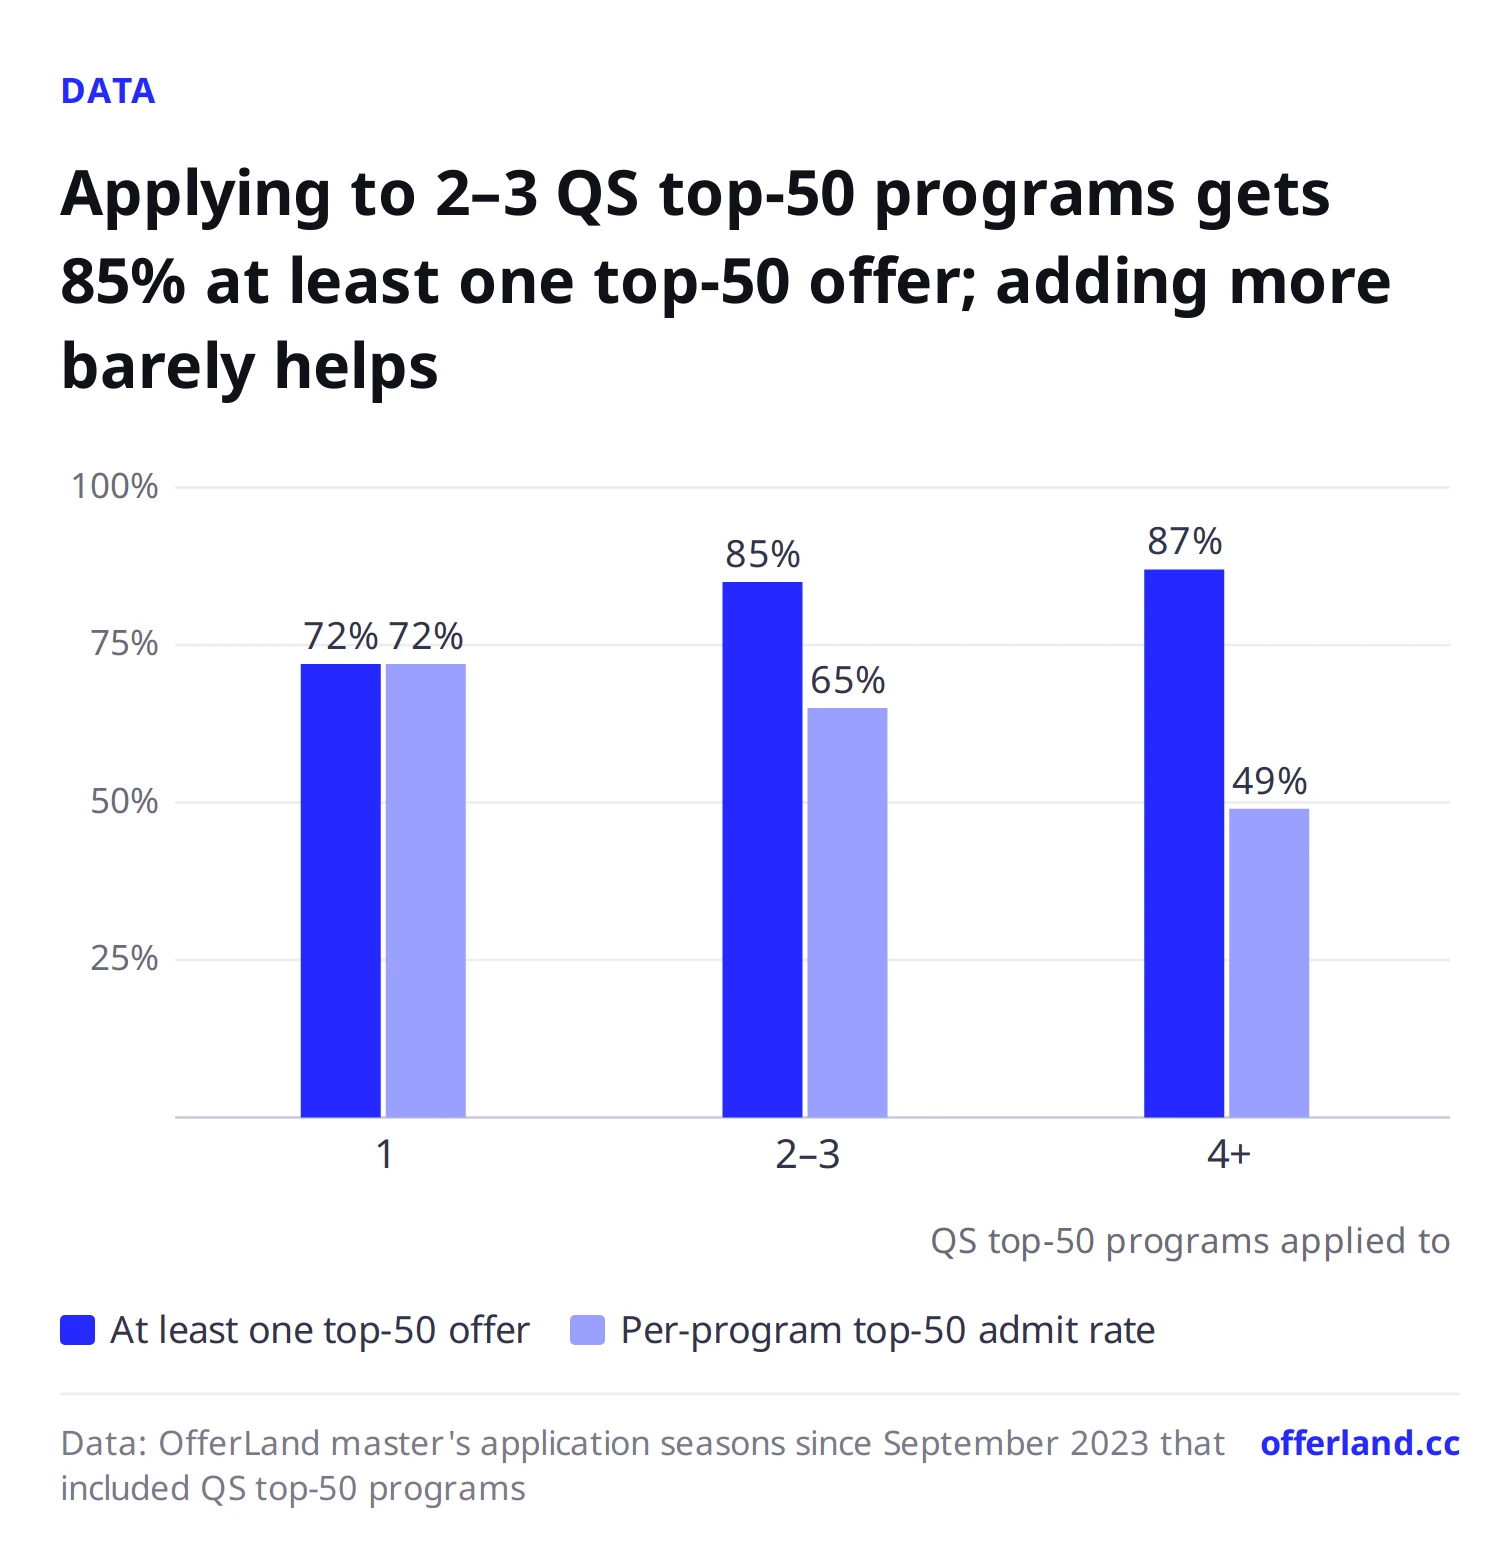
If your goal is at least one top-50 offer, look at how many top-50 programs people applied to:
QS top-50 programs applied to | Cycles | At least one top-50 offer | Top-50 per-program admit rate |
|---|---|---|---|
1 | 141 | 72% | 72% |
2–3 | 152 | 85% | 65% |
4 or more | 45 | 87% | 49% |
Going from 1 to 2–3 raises the share with a top-50 offer from 72% to 85%. Adding more barely moves that share, while the per-program admit rate falls to 49%; the extra programs are probably harder to get into. Among those who applied to just 1 top-50 program, the ones admitted had a median GPA of 3.80 (34 people), and those who weren't had 3.60 (17 people).
The most-reported top-50 schools in the last three cycles include UCL, the University of Manchester, UCLA, KCL, UC Berkeley, and Imperial College London; popular schools ranked 51 to 100 include UIUC, UCSD, and CMU. A separate column covers which schools people tend to apply to together.
How to use this data
4 to 6 programs is the range for most people. In the last three cycles, the middle 50% applied to 2 to 6, and almost everyone who applied to 4 or more got at least one offer.
Volume can't replace tiering. Admit rates differ by 13 percentage points between the top 50, ranks 51 to 100, and schools below 100. Putting at least 1 to 2 programs in each tier is safer than betting everything on one tier.
2 to 3 dream schools is enough. Going from 1 to 2–3 top-50 programs has the clearest effect; beyond that, weigh the time, application fees and the quality of your materials.
If your GPA is around 3.6, add more safety schools. In the group that applied to just 1 top-50 program and didn't get in, the median GPA was 3.60.
Check each school's results first. Use the admission results search to see how many people got into the programs you want and what their backgrounds were; for site-wide numbers, compare with the 2026 admissions report and admissions data by field.
These are statistics from the site's own sample and can't guarantee any individual's outcome.
FAQ
How many grad schools should I apply to?
Among OfferLand master's applicants in the last three cycles, the median was 4 programs at 3 schools, with the middle 50% between 2 and 6. 99% of those who applied to 4 or more got at least one offer.
Does applying to more schools raise my chances of getting in?
Your chance of getting at least one offer goes up, but the per-program admit rate goes down. In the site's data, people applying to 2 to 3 programs had an 85% per-program admit rate, which fell to 53% at 8 or more. The likelier reason is that people who apply widely report more completely, rejections included; by QS ranking, they did not apply to more top-50 schools.
How many schools should I apply to for a shot at the QS top 50?
The site's data shows that 85% of people who applied to 2 to 3 QS top-50 programs got at least one top-50 offer; it was 72% for those who applied to just 1 and 87% for those who applied to 4 or more, a small difference.
Is applying to just one school risky?
Of the 110 people in the last three cycles who reported only 1 program, 11 got no offer, the highest share of any group. Some may have applied to more and reported only one, but applying to just one school does mean you have no backup.
About the data
Sample: master's application results self-reported by OfferLand users (degree listed as Masters, excluding MBA, PhD and undergraduate), counting only users whose accounts have not been deleted. The main analysis uses results reported since September 2023: 565 application cycles (553 people) and 2,390 programs. All data with report dates from 2011 onward covers 1,522 application cycles.
Application cycle: split by the reported result date, with September through the following August counting as one cycle. Applications by the same person in different cycles are counted separately.
Number of programs: the distinct programs reported within one application cycle. Multiple results for the same program are merged into one, and it counts as an offer if any of them is an offer. Waitlists and pending results are not counted.
Admit rate: offers (admit, decision) ÷ (offers + rejections). The definition matches the data methodology.
GPA: only reported values on a 4.0 scale between 0 and 4, counted once per application cycle. Rankings use QS 2027.
Cells with fewer than 5 results show no figures.
These are statistics from OfferLand's own sample, self-reported by users, not official school data. Reporting bias (people logging only offers, and those without offers reporting less often) pushes admit shares up. Data as of October 18, 2026.
OfferLand editorial team · Jason · Last updated 2026-11-05 · About the editorial team
See which schools admitted applicants with a background like yours
Search resultsSchools in this post
- Carnegie Mellon University (CMU)
- The University of Manchester
- University of California, Los Angeles (UCLA)
- University College London (UCL)
- King's College London (KCL)
- University of California, Berkeley (UCB)
See each school's applicant numbers, admit rates and past applicants' results
See admission data for these schools