Translated by OfferLand from the original Traditional Chinese post. View original

OfferLand
Nov 6
Admit Rates for GPAs Below 3.3: Which Schools Accept a Low GPA
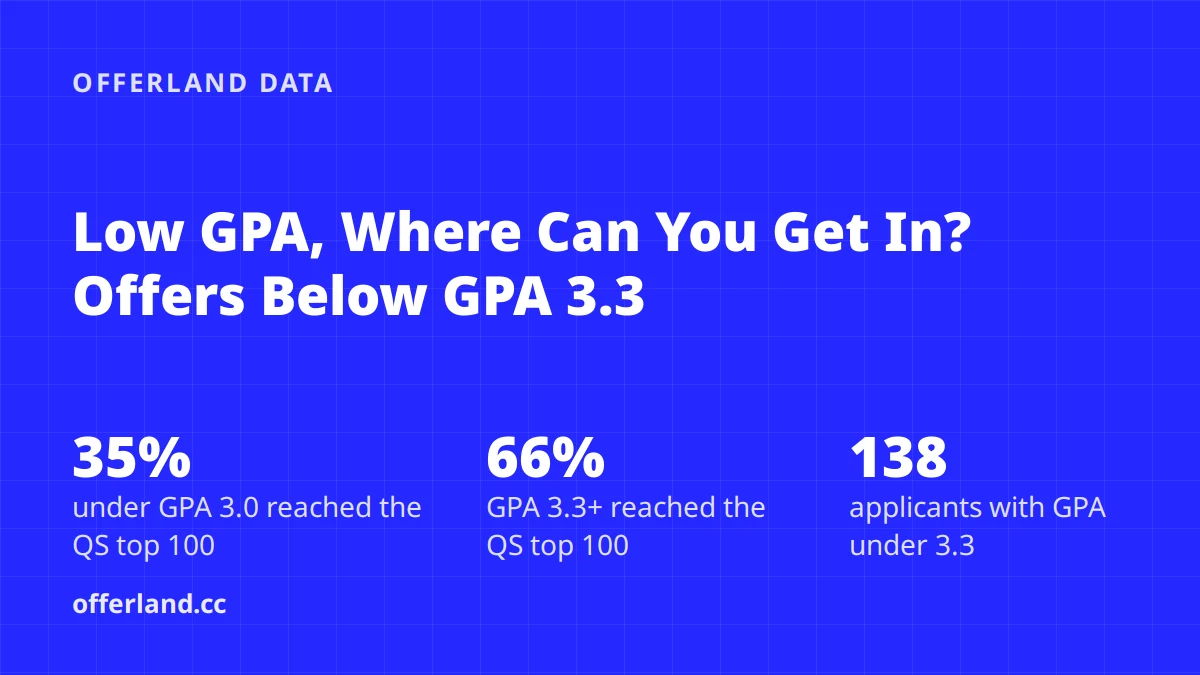
A low GPA matters most for "which tier you can get into": among admitted applicants with a GPA below 3.0 (on a 4.0 scale), only 35% had their best offer at a QS top-100 school, compared with 66% for those at 3.3 or above. On the surface the admit rates look similar (75% vs. 76%), but that mostly reflects the fact that people who report results tend to have offers; it doesn't mean GPA doesn't matter. Low-GPA admits came most often from schools like UT Dallas, ASU, Northeastern and USC, and were concentrated in business analytics, finance and information technology.
Older students on the forum have already shared their low-GPA application experiences. This post looks only at the numbers: which schools, which programs, what applicants did to compensate, and the limits of these numbers.
Key takeaways
138 applicants with a GPA below 3.3 reported 429 applications with a decision, with a 75% admit rate; for GPAs of 3.3 or above it was 76% (1,843 results).
The gap shows up at higher-ranked schools: for master's applications at QS 51–100, the low-GPA group's admit rate was 61%, compared with 74% for everyone else.
Looking at "each person's best offer," 35% of those below 3.0 reached the QS top 100, compared with 51% for GPAs of 3.0–3.29 and 66% for 3.3 or above.
The schools with the most low-GPA admits were UT Dallas (21 offers), ASU (16), Northeastern (12) and USC (11).
Low-GPA admits had a median TOEFL of 90, lower than the 97 for admits with a GPA of 3.3 or above; the data doesn't show that "only exceptionally high test scores can make up for it."
Low-GPA admit rates by QS ranking tier
Overall admit rates are similar, but at QS 51–200 the low-GPA group's admit rate is clearly lower, by 9 to 13 percentage points. The table below counts only master's applications (PhD and MBA applicants differ too much in makeup and would distort the comparison).
QS 2027 rank | Admit rate, GPA below 3.3 (results / people) | Of which GPA below 3.0 (results) | Admit rate, GPA 3.3 or above (results) |
|---|---|---|---|
1–50 | 78% (60 / 38 people) | 85% (20) | 68% (389) |
51–100 | 61% (88 / 43 people) | 55% (22) | 74% (516) |
101–200 | 69% (90 / 48 people) | 70% (23) | 78% (353) |
Below 200 | 83% (147 / 79 people) | 89% (53) | 92% (392) |
No QS rank | 91% (33 / 30 people) | 94% (16) | 95% (64) |
The low-GPA admit rate for the QS top 50 is actually higher, but that doesn't mean a low GPA makes the top 50 easier. A more reasonable reading is that low-GPA applicants who dared to apply to the top 50 and chose to report were mostly confident in other parts of their profile, and those who were rejected were less likely to come back and report. This cell has only 38 people, so take it lightly.
Another angle makes the difference easier to see: take each person's "best-ranked offer" and see which tier it falls in.
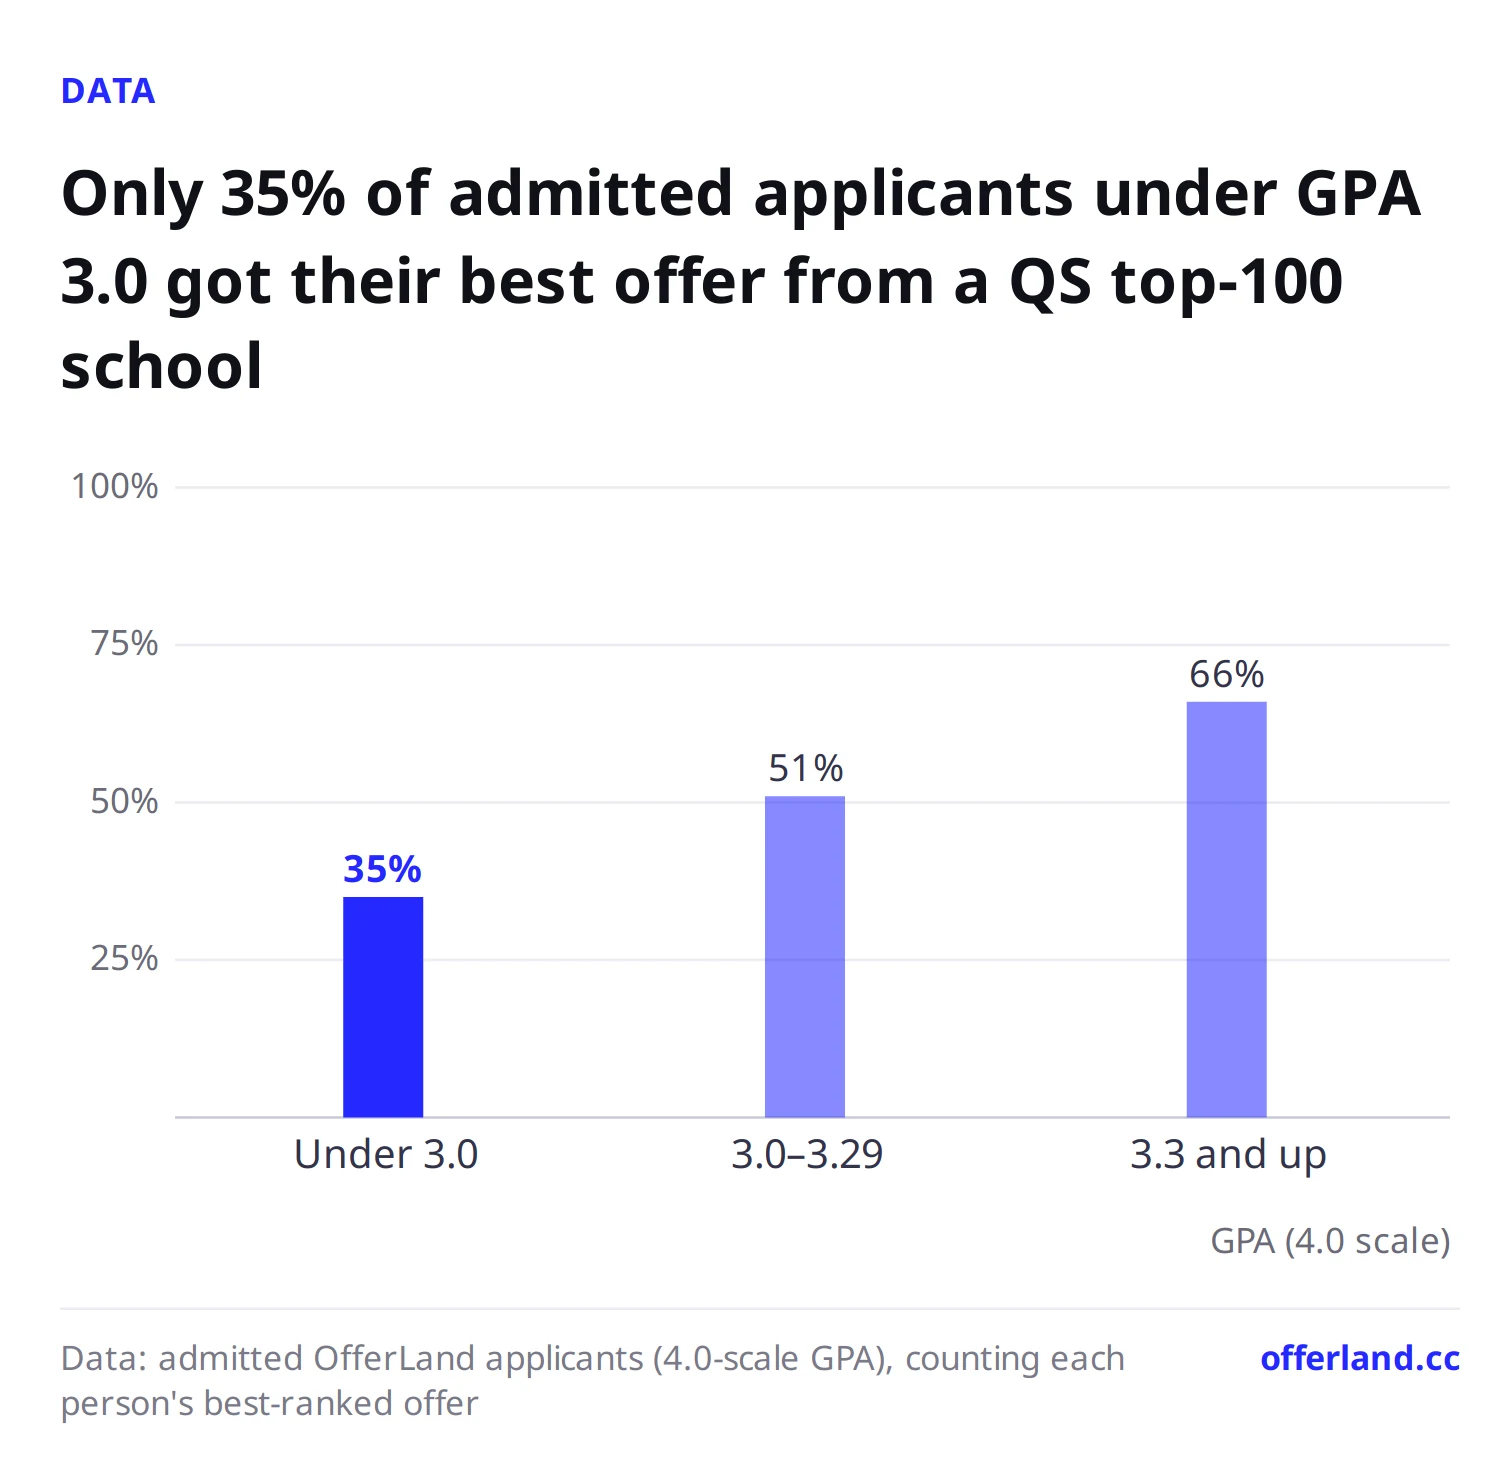
GPA range | People with an offer | Best offer in QS top 50 | QS 51–100 | QS 101–200 | QS below 200 | No QS rank | Share reaching the QS top 100 |
|---|---|---|---|---|---|---|---|
Below 3.0 | 57 | 14 | 6 | 6 | 21 | 10 | 35% |
3.0–3.29 | 80 | 21 | 20 | 16 | 20 | 3 | 51% |
3.3 or above | 479 | 174 | 143 | 69 | 75 | 18 | 66% |
A GPA of 3.0 is a visible line: at 3.0–3.29, half of applicants still got a QS top-100 offer, but below 3.0 that drops to about a third, and the most common place for their best offer is a school ranked below 200 by QS.
Schools and programs with the most low-GPA admits
The table below lists schools with at least 5 offers to applicants with a GPA below 3.3. Most are US state universities and private schools known for professional master's programs.
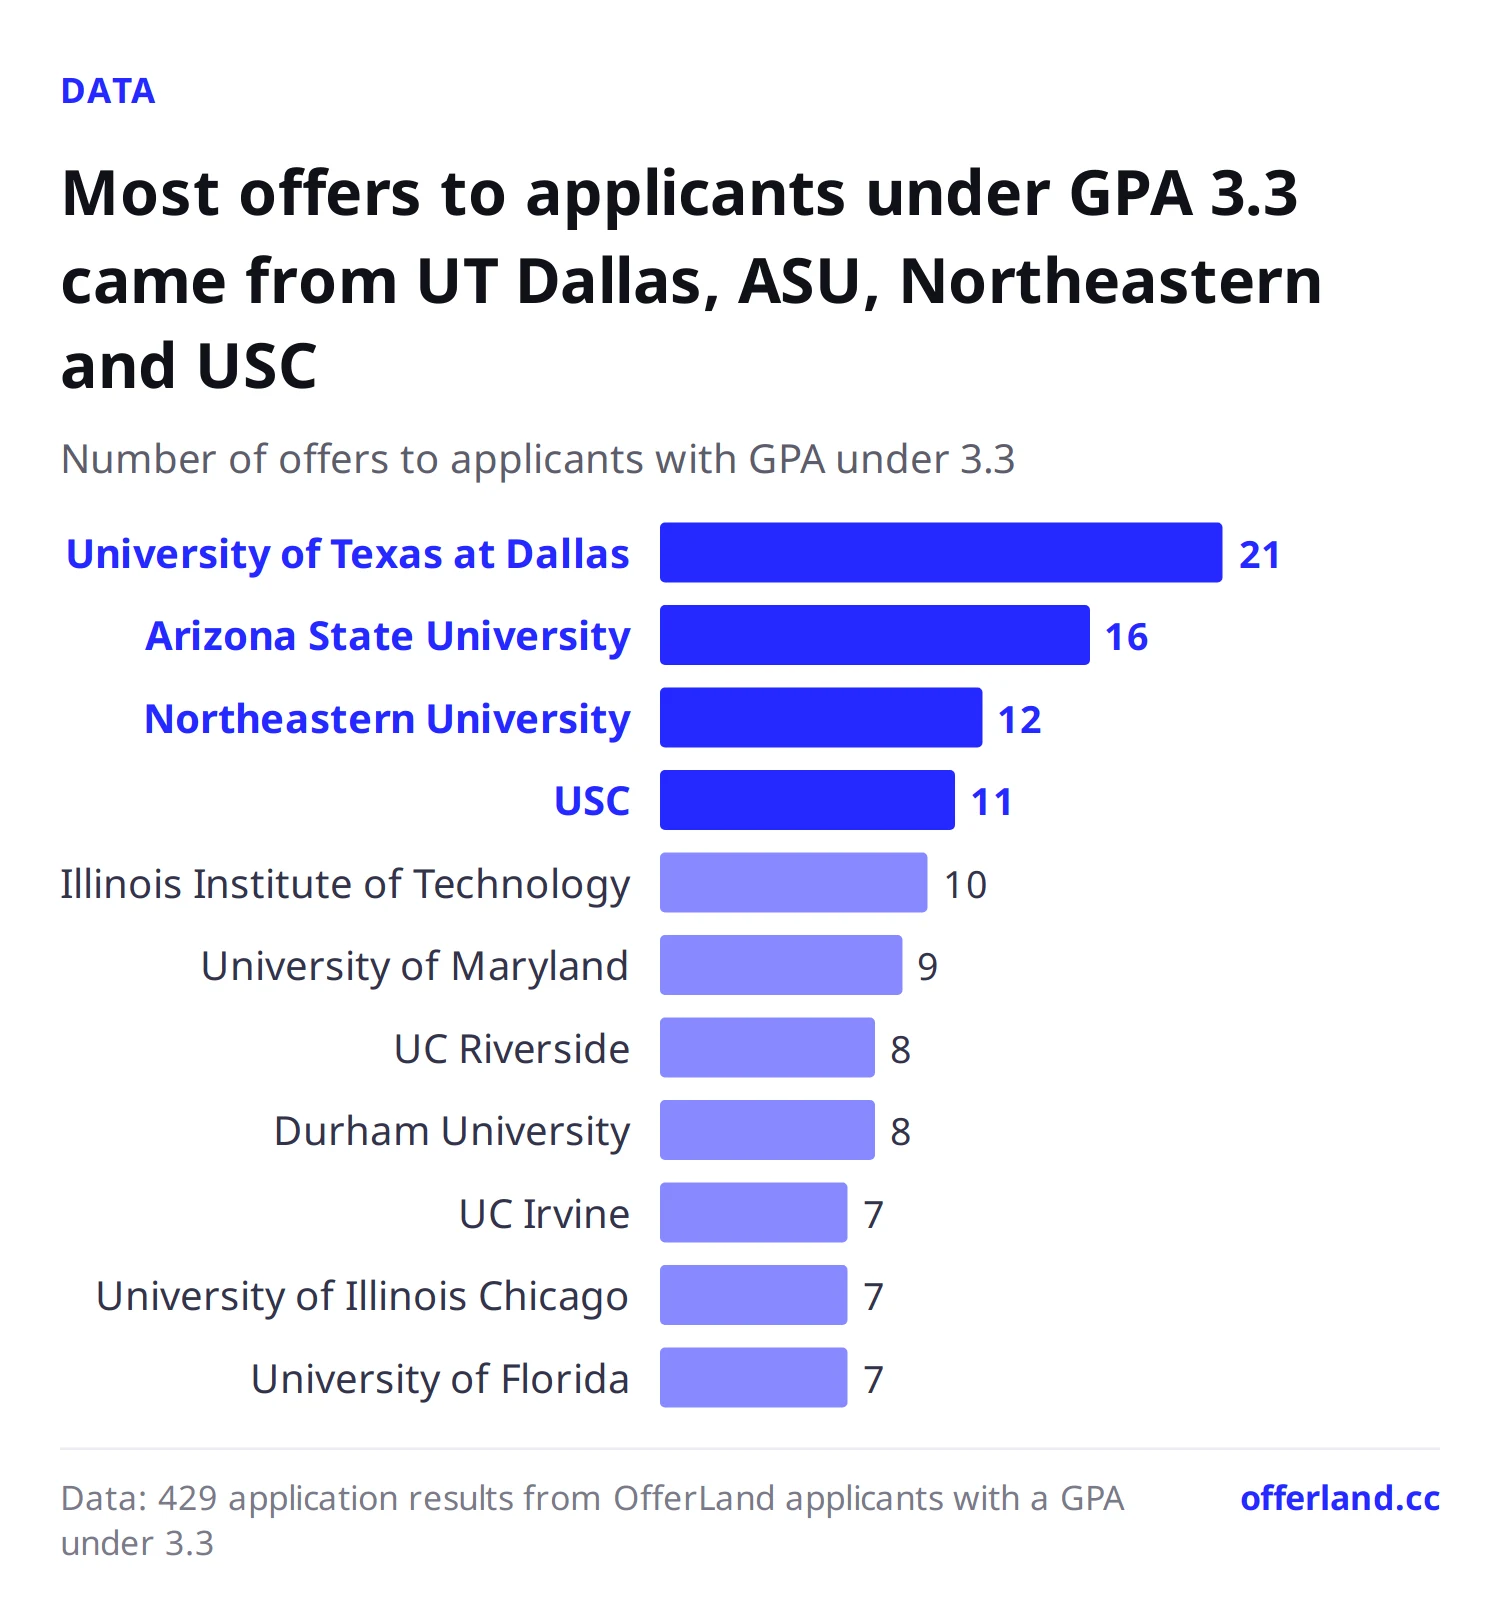
School | QS 2027 | US News 2027 | Offers | Admit rate (results with a decision) |
|---|---|---|---|---|
686 | 121 | 21 | 95% (22) | |
172 | 121 | 16 | 84% (19) | |
385 | 42 | 12 | 75% (16) | |
153 | 27 | 11 | 79% (14) | |
620 | 121 | 10 | 100% (10) | |
252 | 49 | 9 | 90% (10) | |
UC Riverside | 398 | 80 | 8 | 89% (9) |
85 | N/A | 8 | 89% (9) | |
UC Irvine | 252 | 34 | 7 | 64% (11) |
UIC | 370 | 95 | 7 | 88% (8) |
University of Florida | 228 | 34 | 7 | 78% (9) |
University of Washington | 92 | 49 | 6 | 67% (9) |
The University of Sydney | 28 | N/A | 6 | 100% (6) |
Northwestern University | 45 | 9 | 6 | 75% (8) |
Michigan State University | 182 | 69 | 6 | 67% (9) |
University of Glasgow | 80 | N/A | 5 | 83% (6) |
University of Leeds | 77 | N/A | 5 | 83% (6) |
At the level of individual programs, only three reach 5 offers: UT Dallas MS in Finance (6 for 6), UT Dallas MS in Business Analytics (5 for 5), and UMD Marketing Analytics (5 for 5). Every other program has fewer than 5 results per cell and isn't listed.
By field, business and applied IT are friendlier to low GPAs, while EECS and engineering show bigger gaps. The table below lists only fields with at least 5 people in the low-GPA group.
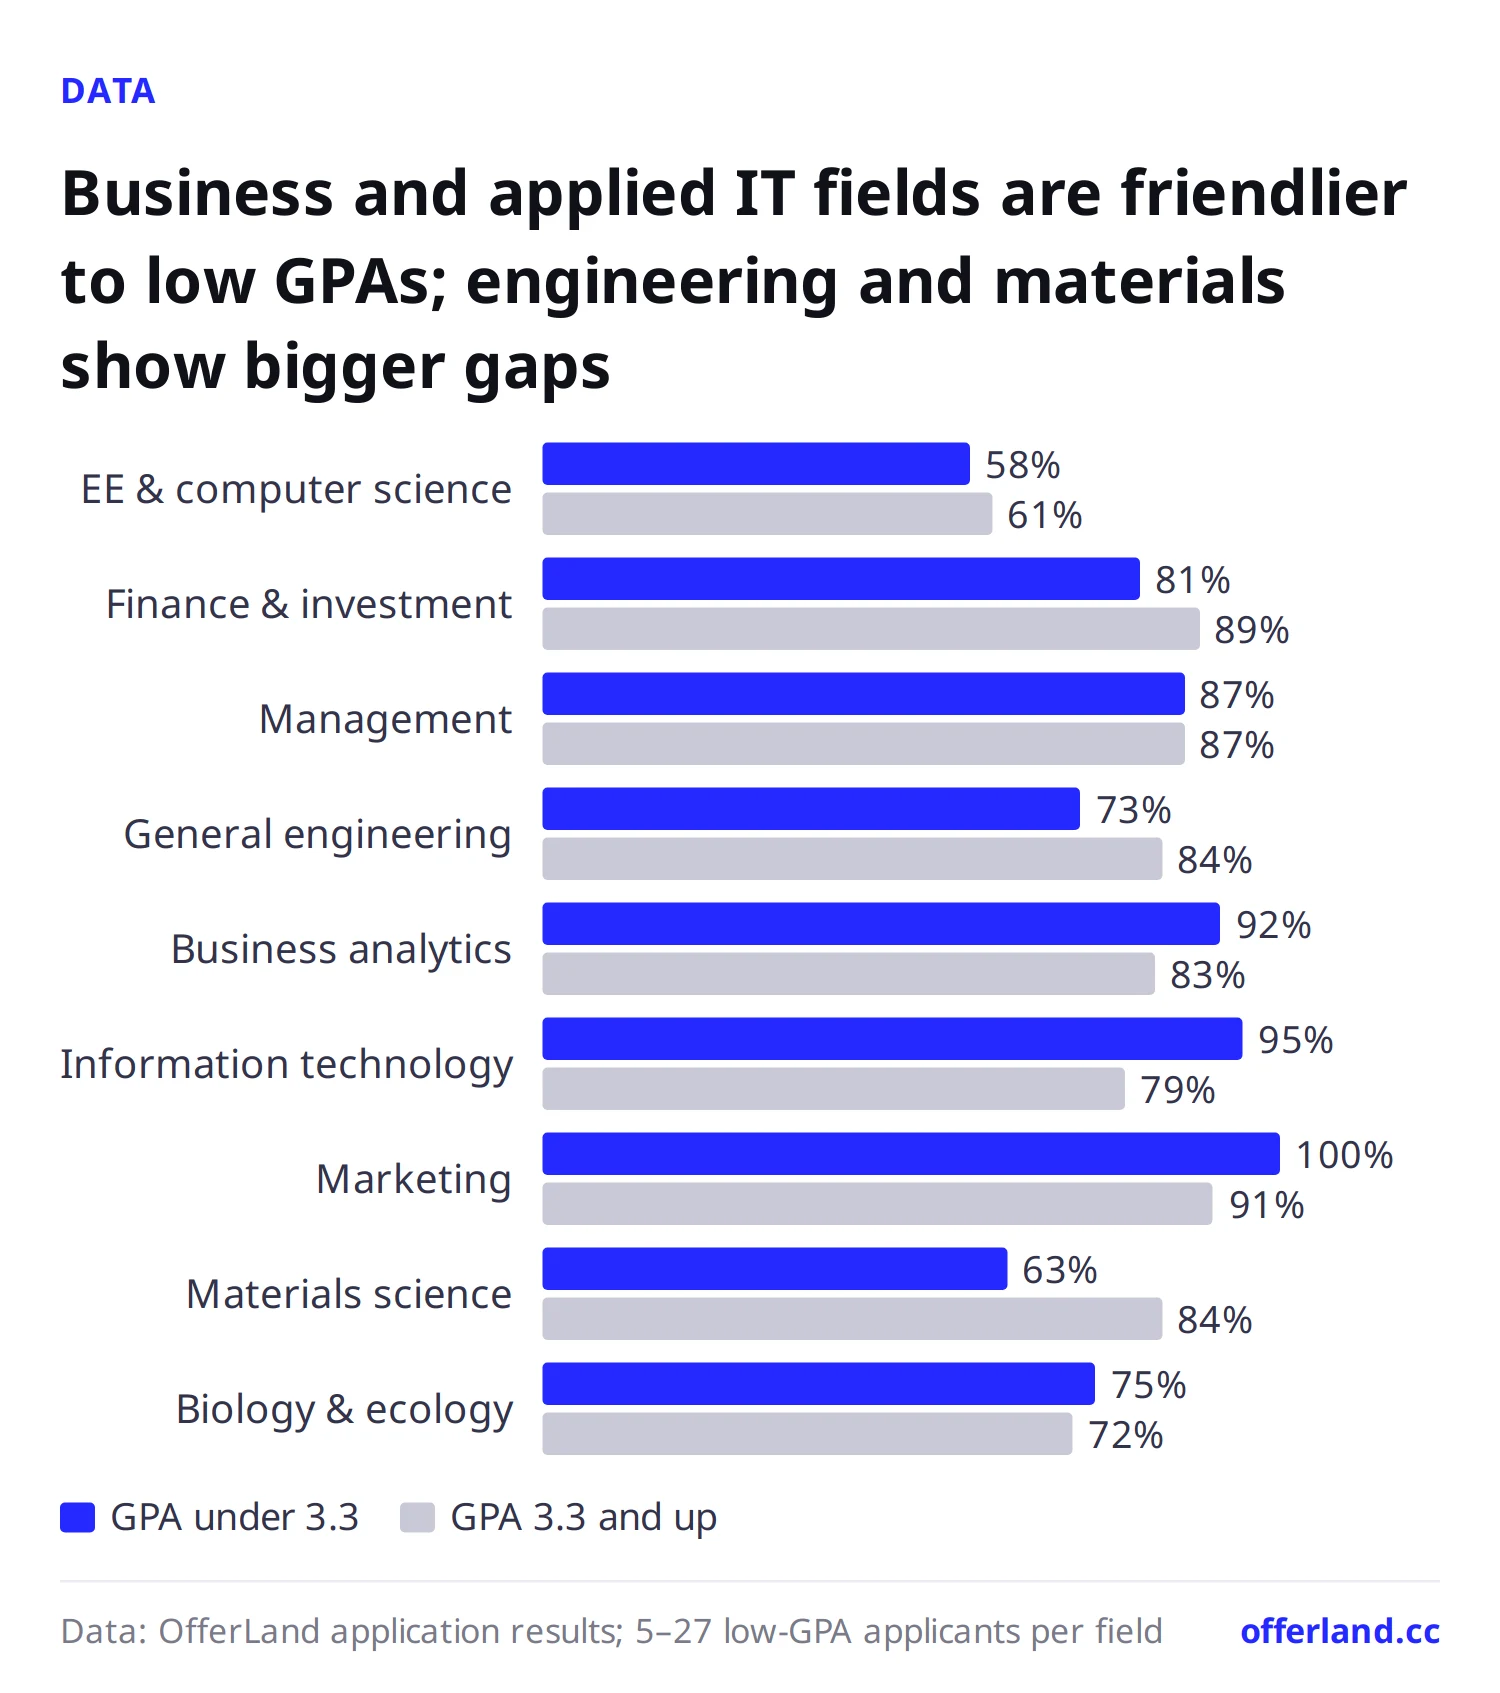
Field | Admit rate, GPA below 3.3 (results / people) | Admit rate, GPA 3.3 or above (results) |
|---|---|---|
Electrical Engineering & Computer Science | 58% (102 / 27 people) | 61% (487) |
Finance & Investment | 81% (58 / 14 people) | 89% (177) |
Business Administration (MBA/MiM) | 87% (45 / 27 people) | 87% (145) |
General Engineering | 73% (30 / 16 people) | 84% (162) |
Business Analytics | 92% (26 / 16 people) | 83% (137) |
Information Technology | 95% (22 / 16 people) | 79% (95) |
Marketing | 100% (18 / 11 people) | 91% (111) |
Materials Science | 63% (16 / 7 people) | 84% (68) |
Biology & Ecology | 75% (12 / 5 people) | 72% (36) |
In EECS, both groups are only around 60%, mainly because everyone applies to the popular schools; full data for this field will be covered in a separate column on CS and EECS master's programs. Data science had fewer than 5 low-GPA applicants, too small a sample.
What low-GPA admits had going for them
Many people assume a low GPA has to be offset by a high TOEFL or GRE. The site's data doesn't really support that: low-GPA admits actually had slightly lower median test scores than admits with a GPA of 3.3 or above.
Metric | Admits with GPA below 3.3 (137 people) | Admits with GPA 3.3 or above (479 people) |
|---|---|---|
Median GPA | 3.00 | 3.70 |
Median TOEFL (25th/75th percentile) | 90 (83–96), 76 reported | 97 (91–103), 275 reported |
Median IELTS (25th/75th percentile) | 6.5 (6–7), 33 reported | 7 (6.5–7), 121 reported |
Median GRE total (25th/75th percentile) | 315 (309–320), 51 reported | 318 (313–322), 180 reported |
Median GRE Quant | 164 | 168 |
Filled in the experience field | 5% (7 people) | 10% (49 people) |
Most low-GPA admits got in by "applying to the right schools," not by "scoring exceptionally high." Plenty got offers with a TOEFL around 90 and a GRE around 315, but their offers were also concentrated at the schools in the previous section. Few people in either group filled in the experience field, so there's no way to judge the effect of work or research experience.
US vs. UK: the UK is more sensitive to GPA
In the US, the low-GPA admit rate is almost the same as everyone else's; in the UK it's 8 percentage points lower, with the biggest gap at QS 51–100. The UK low-GPA sample is only 17 people, so read it conservatively.
Country / QS tier (tier rows count master's only) | Admit rate, GPA below 3.3 (results) | Admit rate, GPA 3.3 or above (results) |
|---|---|---|
US, all degrees | 74% (306, 105 people) | 73% (1,361) |
US QS 1–50 | 68% (22) | 61% (202) |
US QS 51–100 | 55% (49) | 68% (352) |
US QS 101–200 | 64% (61) | 74% (276) |
US QS below 200 | 83% (133) | 92% (365) |
UK, all degrees | 76% (83, 17 people) | 84% (392) |
UK QS 1–50 | 81% (16) | 72% (141) |
UK QS 51–100 | 66% (35) | 88% (153) |
UK QS 101–200 | 81% (26) | 95% (64) |
UK master's programs usually convert GPA into a UK degree classification for screening, so the cutoff is clearer; US schools weigh test scores, experience and application materials together and are more flexible. That's also why, at UK schools ranked QS 101–200, applicants with a GPA of 3.3 or above were almost all admitted (95%) while the low-GPA group managed only 81%. UK low-GPA admits had a median IELTS of 7 (11 reported).
How to use this data
Split your list into three tiers: with a GPA of 3.0–3.29, you can put 2–3 QS top-100 schools as reaches, make QS 100–200 or US News 50–120 state universities your core, and add 2 schools from the table above with admit rates of 80% or more as safeties. Below 3.0, add more safeties, because more than half of these applicants had their best offer at a school ranked below 200 by QS or with no QS rank.
The program matters more than the school's name: at the same school, business analytics, information technology and marketing master's programs are clearly more accepting of low GPAs than EECS or materials. If your background allows a switch to a professional master's, you'll have many more options.
Aim to clear the test-score cutoff first: the data doesn't show high scores offsetting a low GPA, but scoring below a school's minimum will definitely get you screened out. Get your TOEFL or IELTS to your target schools' cutoff first, then spend your time on your application materials and school list.
For the UK, check the conversion standards first: before applying to the UK, confirm how your target schools convert GPAs from Taiwanese universities. If you fall short, prioritize schools ranked below 100 by QS or programs that explicitly accept lower GPAs.
See where people like you ended up: use the OfferLand admission results search to filter by GPA and see which schools and programs actually admitted people with similar backgrounds.
This data can help you decide where to apply, but it can't guarantee admission; in the end it depends on each school's applicant pool that year and your application as a whole.
FAQ
Q: Can I apply to US grad schools with a 3.0 GPA?Yes. Among the site's 80 admits with a GPA of 3.0–3.29, 51% got an offer from a QS top-100 school. The schools admitting them most often were UT Dallas, ASU, Northeastern, USC and similar schools.
Q: Do I still have a chance with a GPA below 3.0?Yes, but be more realistic about your school list. 57 people with a GPA below 3.0 reported at least one offer; 14 of them had their best offer in the QS top 50, and 21 at schools ranked below 200 by QS. Add more safety schools.
Q: With a low GPA, how high does my TOEFL or GRE need to be?On the site, low-GPA admits had a median TOEFL of 90 and a median GRE of 315, both lower than admits with higher GPAs. What matters is clearing the school's cutoff; high scores in themselves showed no clear compensating effect.
Q: With a low GPA, is the UK or the US a better bet?In the site's data, the US low-GPA group had a 74% admit rate, similar to everyone else; in the UK it was 76%, lower than the 84% for GPAs of 3.3 or above. UK screening on GPA is more clear-cut, but the UK sample is only 17 people, so treat it as a rough guide.
About the data
"Taiwanese students" refers to OfferLand users: the site's users are mainly students from Taiwan. The data is self-reported, has no nationality field, and is not official school data.
Source: statistics from OfferLand's own sample, self-reported by users, not official school data.
Sample scope: only users with a GPA on a 4.0 scale and 0 < GPA ≤ 4; 4.3-scale and percentage GPAs are excluded. Result dates range from December 2015 to July 2026, with 90% falling in 2018–2025. Data as of 2026-10-12.
Groups: GPA below 3.3 is the "lower GPA" group (175 people reported a GPA, 138 of whom had application results), further split into below 3.0 and 3.0–3.29.
Admit rate definition: (admitted + admitted and enrolled) ÷ (admitted + admitted and enrolled + rejected). Waitlisted and pending results are excluded (1 in the low-GPA group, 7 in the other group).
Rankings: QS 2027 and US News 2027. Schools without a QS rank are listed as a separate group.
TOEFL, IELTS, GRE: each person's highest total score, counting only those who reported one. For the experience field we only check whether it was filled in, not what it says.
Sample limitations: reporters skew heavily toward people with offers. Of the 138 people below 3.3 with application results, 137 reported at least one offer, which means people with no offers rarely come back to report, so actual admit rates should be lower than shown. The low-GPA group reported about 3 results per person on average and the 3.3-or-above group about 4, and some people may have reported only the schools that admitted them. Every statistic cell has at least 5 results; cells with fewer than 5 are not shown.
Further reading
OfferLand editorial team · Jason · Last updated 2026-11-06 · About the editorial team
See which schools admitted applicants with a background like yours
Search resultsSchools in this post
- University of Texas Dallas (UT Dallas, UTD)
- University of Southern California (USC)
- Arizona State University (ASU)
- University of Maryland (UMD)
- University of Florida
- University of Illinois at Chicago (UIC)
See each school's applicant numbers, admit rates and past applicants' results
See admission data for these schools