Translated by OfferLand from the original Traditional Chinese post. View original

OfferLand
Updated Oct 18
Mechanical, Materials and Chemical Engineering Master's: Admit Rates, GPA and TOEFL from 632 Results
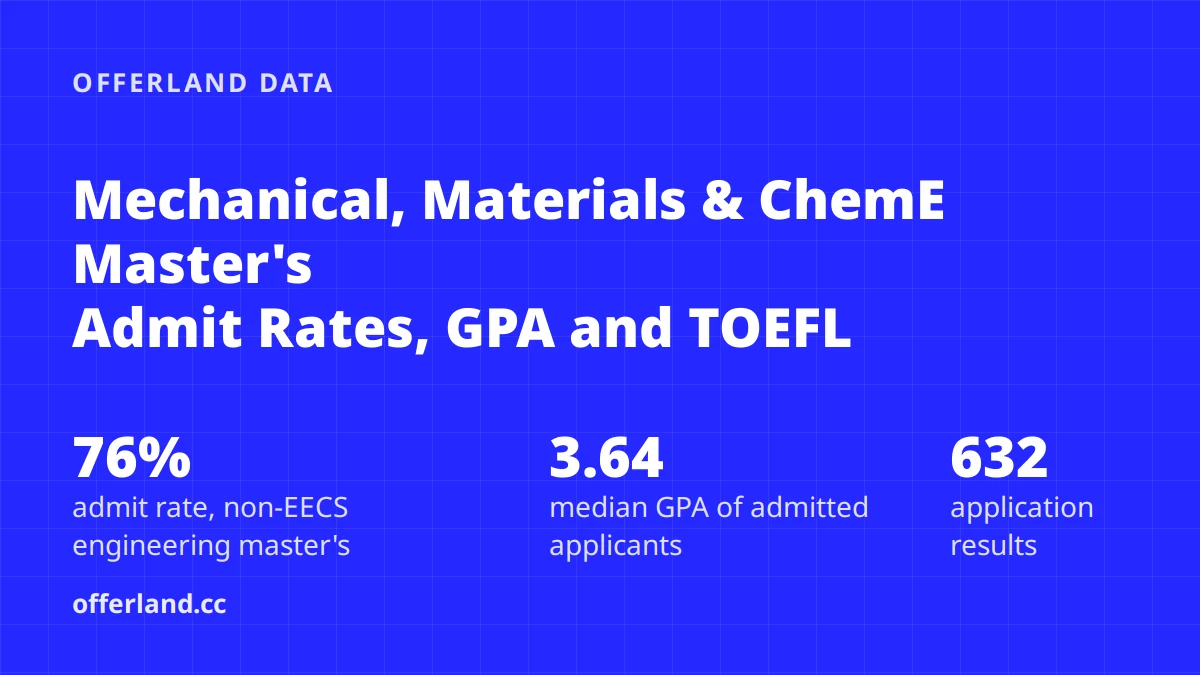
Across 632 application results on OfferLand for engineering master's programs outside EE and CS (mechanical, materials, chemical and industrial engineering), the overall admit rate is 76%. Admitted applicants have a median GPA of 3.64 (on a 4.0 scale) and a median TOEFL of 99. QS top-50 schools are clearly harder, at 68%, while QS 51–100 is 81%. The subfields differ a lot: mechanical/aerospace is lowest at 67%, and materials is at 79%.
Key takeaways
Of 632 applications with a result, 483 were admits, an admit rate of 76%; 205 of the 224 applicants got at least one offer.
Admitted applicants' median GPA is 3.64 (85 people; 25th–75th percentile 3.40–3.80), and median TOEFL is 99 (139 people; 91–104).
People admitted to a QS top-50 school have a median GPA of 3.70 and TOEFL of 102; people admitted to a school outside the QS top 100 (including unranked) have a GPA of 3.56 and TOEFL of 95.
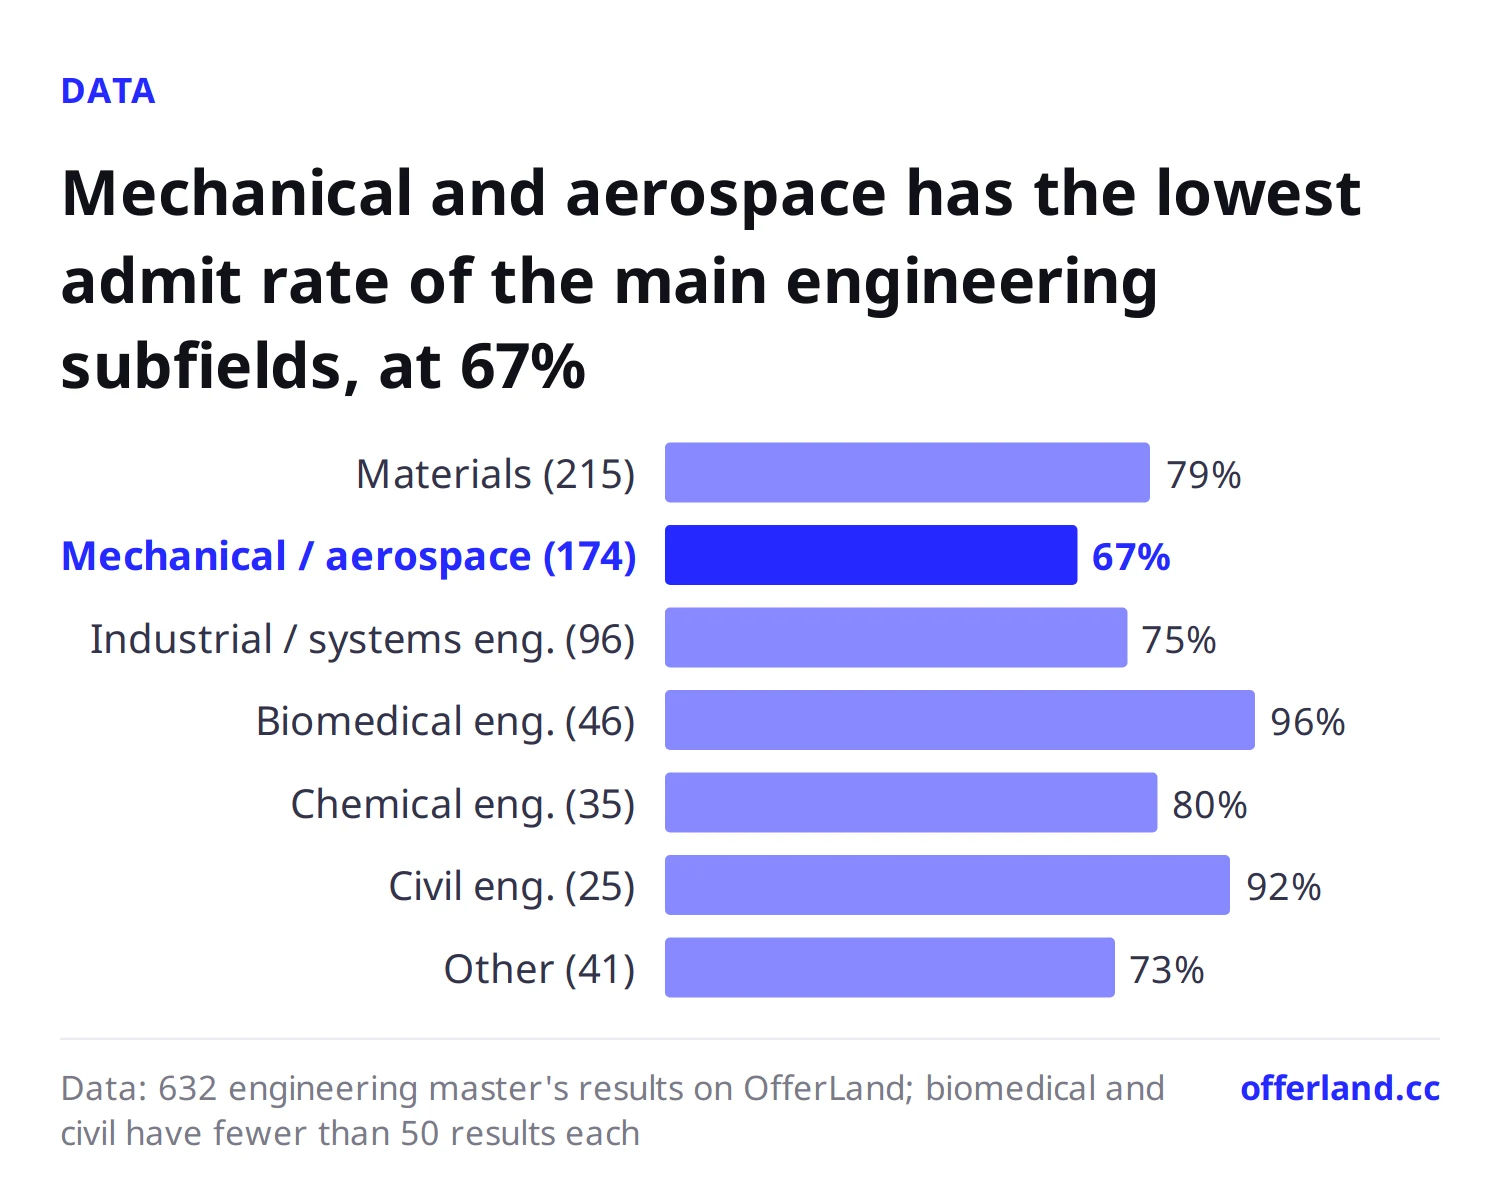
Materials is the subfield with the most applications (215), with a 79% admit rate; mechanical/aerospace has 174, with a 67% admit rate, the lowest among the main subfields.
The 46 people who reported results from 5 or more schools applied to a median of 7 and got 5 offers. None of them were rejected everywhere.
Subfields compared: mechanical has the lowest admit rate, materials the most applications
Subfields are assigned by program name (for example, names containing Mechanical or Aerospace go under mechanical/aerospace). GPA counts only the 4.0 scale, and TOEFL uses each person's highest score.
Subfield | Results | Admits | Admit rate | Applicants | Admitted GPA (median) | Admitted TOEFL (median) |
|---|---|---|---|---|---|---|
Materials | 215 | 169 | 79% | 62 | 3.50 (21 people) | 95 (47 people) |
Mechanical/aerospace | 174 | 117 | 67% | 57 | 3.76 (21 people) | 99 (35 people) |
Industrial engineering/systems/engineering management | 96 | 72 | 75% | 46 | 3.70 (21 people) | 95 (21 people) |
Biomedical engineering | 46 | 44 | 96% | 21 | 3.70 (12 people) | 100 (17 people) |
Chemical engineering | 35 | 28 | 80% | 26 | 3.35 (10 people) | 96 (15 people) |
Civil engineering | 25 | 23 | 92% | 12 | Too few results | 106 (7 people) |
Other (Master of Engineering degrees, financial engineering, etc.) | 41 | 30 | 73% | 38 | 3.67 (14 people) | 102 (15 people) |
Total | 632 | 483 | 76% | 224 | 3.64 (85 people) | 99 (139 people) |
Mechanical/aerospace has the lowest admit rate, yet its admitted applicants have the highest median GPA of any subfield, 3.76, so competition may be stiffer. Materials is the opposite: the admitted median GPA is 3.50, below the overall figure, while the admit rate is higher. Applicants whose GPA doesn't stand out may want to look more closely at materials programs. Biomedical engineering (96%) and civil engineering (92%) each have fewer than 50 results, so treat those as rough figures.
Narrowed to QS top-50 schools, industrial engineering/systems drops to just 39% (18 results), compared with mechanical at 69% (59), materials at 70% (73) and chemical at 79% (19). That's only 18 results, but the gap is clear: if you're applying to top schools in industrial engineering or Operations Research, include more safety schools.
School tiers: the QS top 50 is clearly harder
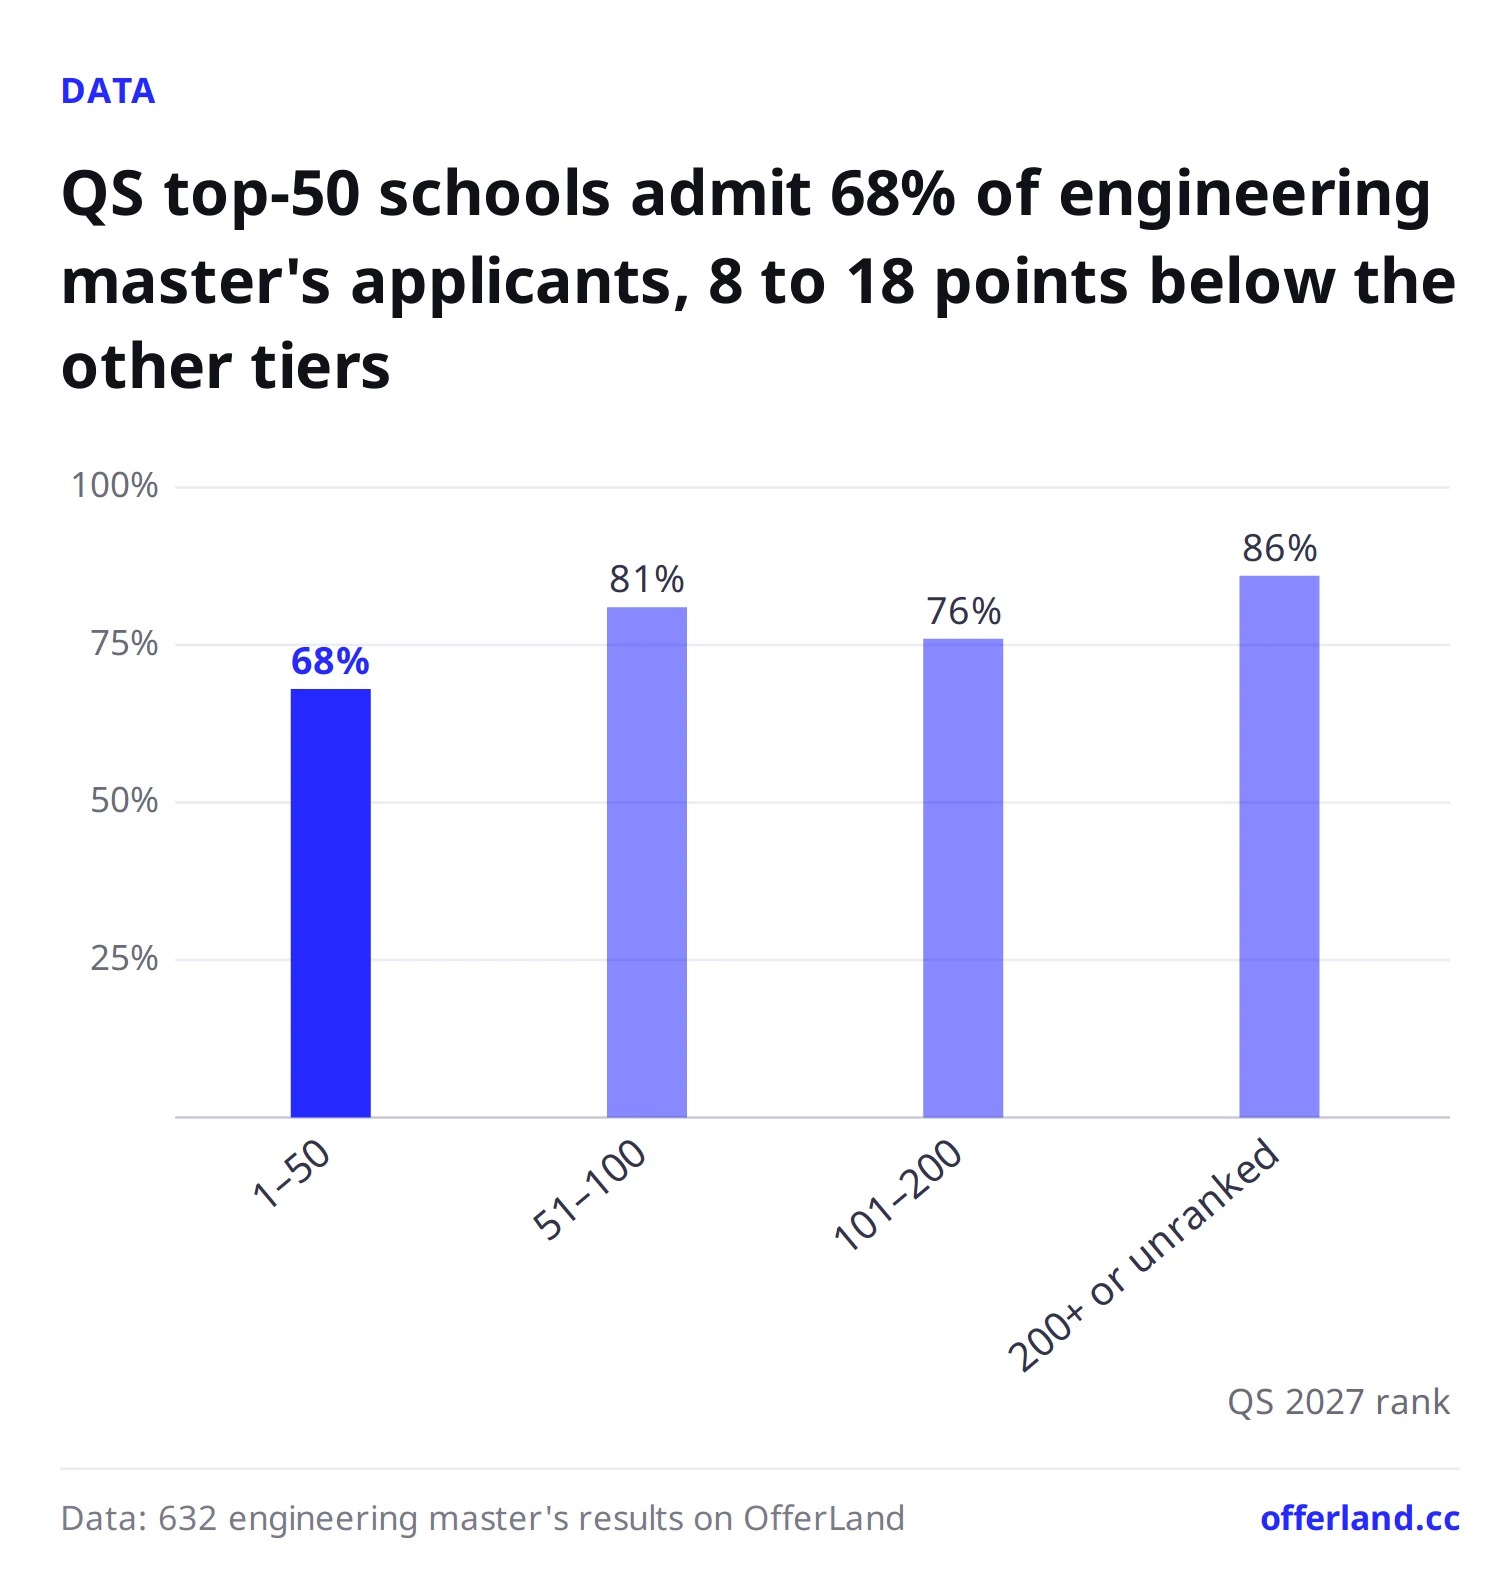
Split by QS 2027 ranking, engineering master's admit rates at the top 50 are 8 to 18 percentage points lower than in the other three tiers.
QS 2027 rank | Results | Admits | Admit rate |
|---|---|---|---|
1–50 | 200 | 135 | 68% |
51–100 | 198 | 160 | 81% |
101–200 | 135 | 103 | 76% |
Outside the top 200 or unranked | 99 | 85 | 86% |
These tiers carry a selection bias: people willing to apply to the QS top 50 tend to have stronger profiles to begin with. Looking only at the 46 people who reported 5 or more results, the admit rate is 61% at the QS top 50 (112 results), 72% at 51–100 (119) and 71% outside the top 100 (113). For the same group of people applying across tiers, the top 50 is still harder.
By country, 90% of the sample is US schools. The US has 568 results with a 76% admit rate; the UK 23 results, 78%; Canada 14, 79%; and 7 countries including the Netherlands, Singapore, Germany and Australia have 27 results combined, 85%. Samples outside the US are small, so use them only as a rough guide.
Popular schools and programs
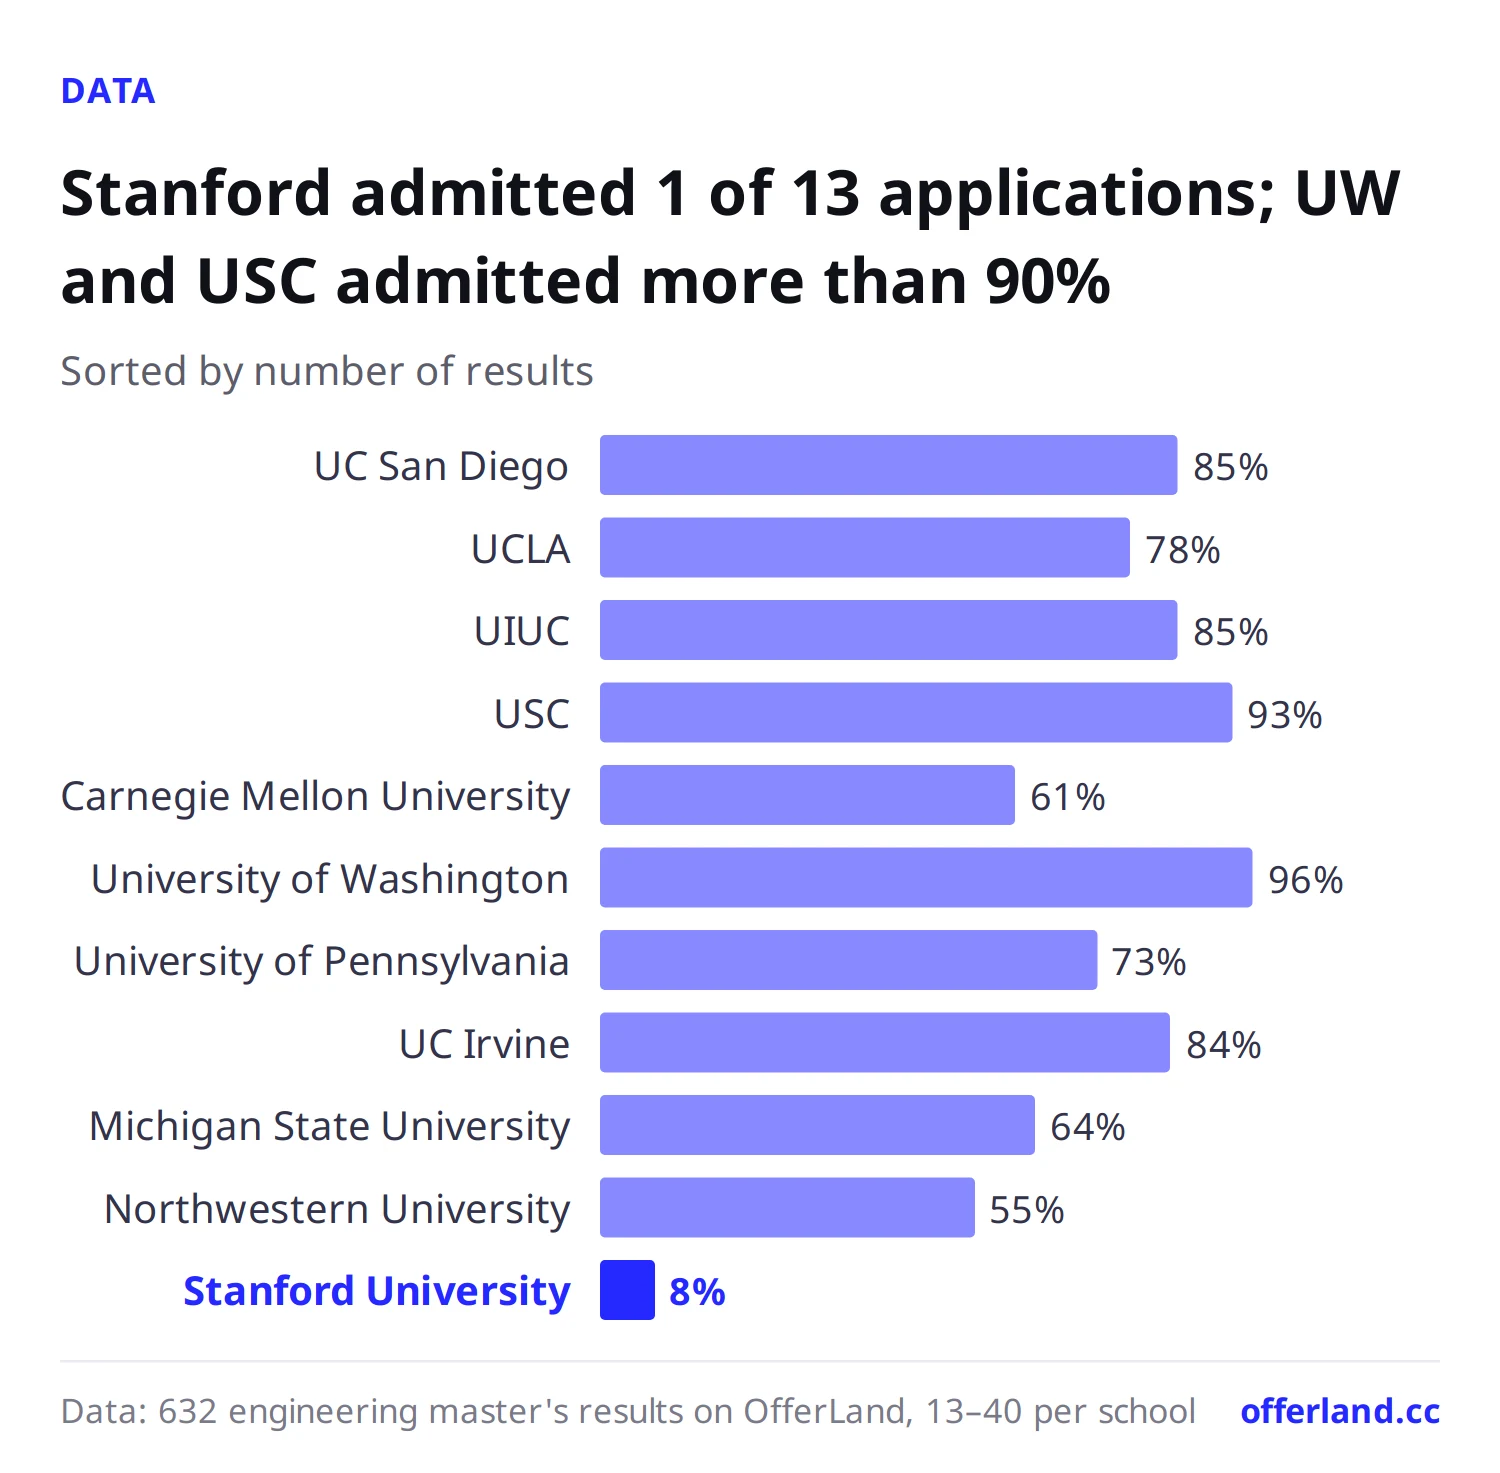
Among the schools with the most reports, three are in the University of California system: UCSD, UCLA and UC Irvine.
School | QS 2027 | US News 2027 | Results | Admit rate |
|---|---|---|---|---|
81 | 29 | 40 | 85% | |
UCLA | 49 | 20 | 36 | 78% |
UIUC | 74 | 34 | 33 | 85% |
USC | 153 | 27 | 30 | 93% |
55 | 14 | 28 | 61% | |
92 | 49 | 28 | 96% | |
UPenn | 15 | 7 | 26 | 73% |
UC Irvine | 252 | 34 | 25 | 84% |
Michigan State | 182 | 69 | 22 | 64% |
Northwestern | 45 | 9 | 20 | 55% |
2 | 5 | 13 | 8% |
Stanford had only 1 admit out of 13 results, the lowest admit rate of any school in this data. Northwestern, Georgia Tech (17 results, 59%), Cornell and UW–Madison (15 results each, 60%) all land between 50% and 60%.
Programs at the same school can differ a lot too. CMU's Materials Science and Engineering has an 80% admit rate (10 results), while its Mechanical Engineering had just 1 admit out of 9. UCSD's Materials Science and Engineering is the single most-applied program, with 22 results and an 86% admit rate; UCLA's Materials Science and Engineering had 12 admits out of 13. All 12 results for UW's Mechanical Engineering MS were admits, as were all 8 for UIUC's Industrial Engineering M.S. On the other side, Stanford's Materials Science and Engineering had only 1 admit out of 8, and Michigan State's mechanical engineering had 2 out of 9.
How to use this data
Pick your subfield first, then your schools. Even outside the QS top 50, mechanical/aerospace has an admit rate of only 66% (115 results), lower than the other subfields, so mechanical applicants should add a few more safety schools. Materials and chemical engineering admit rates are steadier, so you can shift your list upward.
Match your GPA and TOEFL to the tiers. With a GPA of 3.7 and TOEFL of 100 or more, you can add several QS top-50 schools; with a GPA around 3.5 and TOEFL around 95, focus on QS 51–200 and add a few schools outside the top 100.
Look at the program, not just the school name. At schools like CMU and Stanford, admit rates for materials and mechanical can be very different, so check each program separately.
How many to apply to. People who reported 5 or more schools applied to a median of 7 and got 5 offers, which is a useful reference for the size of your list.
Be conservative with industrial engineering at the top 50. IE/OR programs at QS top-50 schools have an admit rate of only 39% (18 results), compared with around 80% in the other tiers.
To see admitted applicants' backgrounds for a single school or program, use the admission results search to filter by school, program and GPA. EE/CS master's, UK master's and low-GPA applications have their own columns, so they aren't repeated here.
FAQ
Q: Is it easy to get into a mechanical engineering master's? In OfferLand's sample, the admit rate for mechanical/aerospace master's programs is 67%, the lowest among the main engineering subfields; admitted applicants' median GPA is 3.76, above the overall 3.64. At QS top-50 schools, mechanical programs admit 69% (59 results).
Q: What GPA do you need for a materials master's abroad? Admitted materials master's applicants have a median GPA of 3.50 (21 people) and median TOEFL of 95 (47 people). Materials has a 79% admit rate, above the engineering master's average, but materials programs at schools like Stanford and Northwestern have noticeably lower admit rates.
Q: What TOEFL score do you need for an engineering master's? The median TOEFL among admitted applicants is 99, with the middle half between 91 and 104. For people admitted to a QS top-50 school, the median is 102. Check each school's published requirements for actual minimums; some programs also set minimum section scores.
Q: How different are PhD and master's admit rates in engineering? OfferLand has 93 PhD results in the same fields (32 applicants), with a 54% admit rate, well below the master's rate of 76%. For detailed PhD data, see the US PhD column.
Data methodology
Sample: master's application results reported by OfferLand users whose primary field (`fields_v2`, `is_primary`) is "General Engineering" or "Materials Science": 633 results in total, of which 632 are admits or rejections (1 pending, left out of the denominator), from 224 applicants. Data as of 2026-10-17.
Timing: result dates cluster in 2023 (315 results) and 2024 (162 results). Reports from before 2022 are almost all admits, which pushes the admit rate up; for 2023–2024 alone, the admit rate is 71% (477 results).
Admit rate = (admitted + admitted and enrolled) ÷ (admitted + admitted and enrolled + rejected).
Subfields are assigned by keywords in the program's English name; names containing Materials go under materials. Different spellings of the same kind of program are grouped into the same subfield.
GPA uses only 4.0-scale data between 0 and 4; TOEFL uses each person's highest total score. GPA and TOEFL are medians of admitted applicants (at least one admit), not of individual applications.
Rankings are QS 2027 and US News 2027. Cells with fewer than 5 results are marked "Too few results" or merged.
These are statistics from OfferLand's own sample, self-reported by users, not official school data. People who report may skew toward those with better outcomes, so admit rates may be higher than in reality.
Further reading
OfferLand editorial team · Jason · Last updated 2026-10-31 · About the editorial team
See which schools admitted applicants with a background like yours
Search resultsSchools in this post
- Stanford University
- University of California, San Diego (UCSD)
- University of California, Los Angeles (UCLA)
- University of Illinois at Urbana-Champaign (UIUC)
- Carnegie Mellon University (CMU)
- University of California, Irvine (UC Irvine, UCI)
See each school's applicant numbers, admit rates and past applicants' results
See admission data for these schools