Translated by OfferLand from the original Traditional Chinese post. View original

OfferLand
Nov 4
MSBA and Finance Master's Admit Rates: US, UK and Singapore Compared
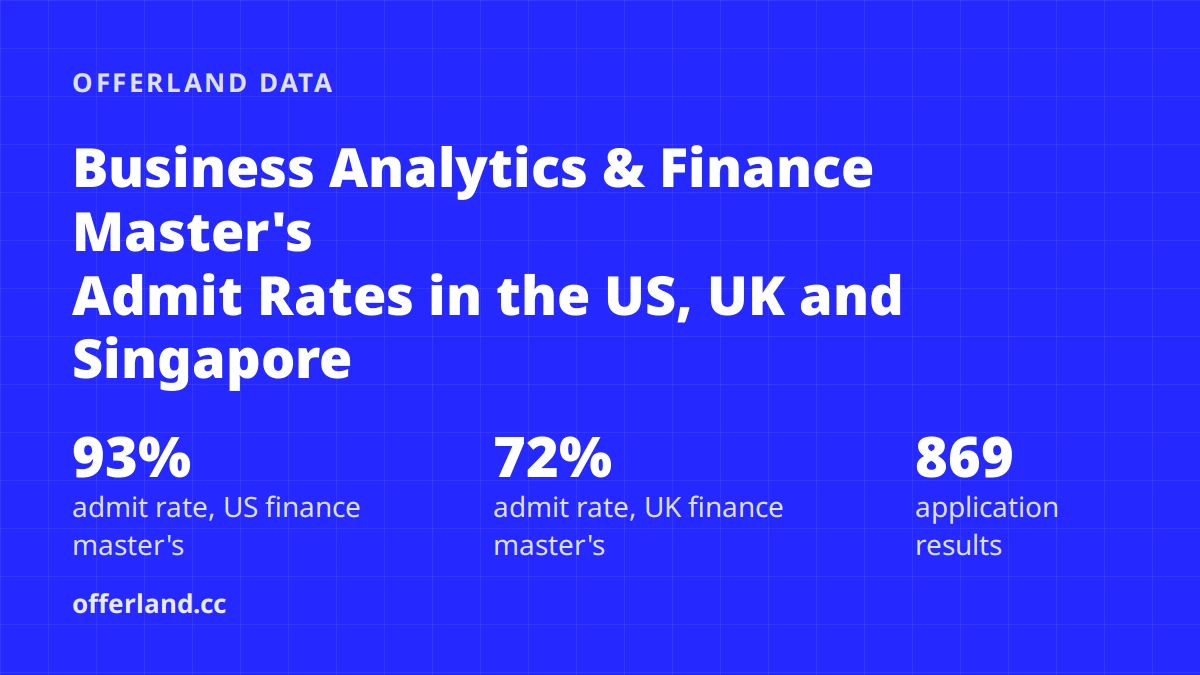
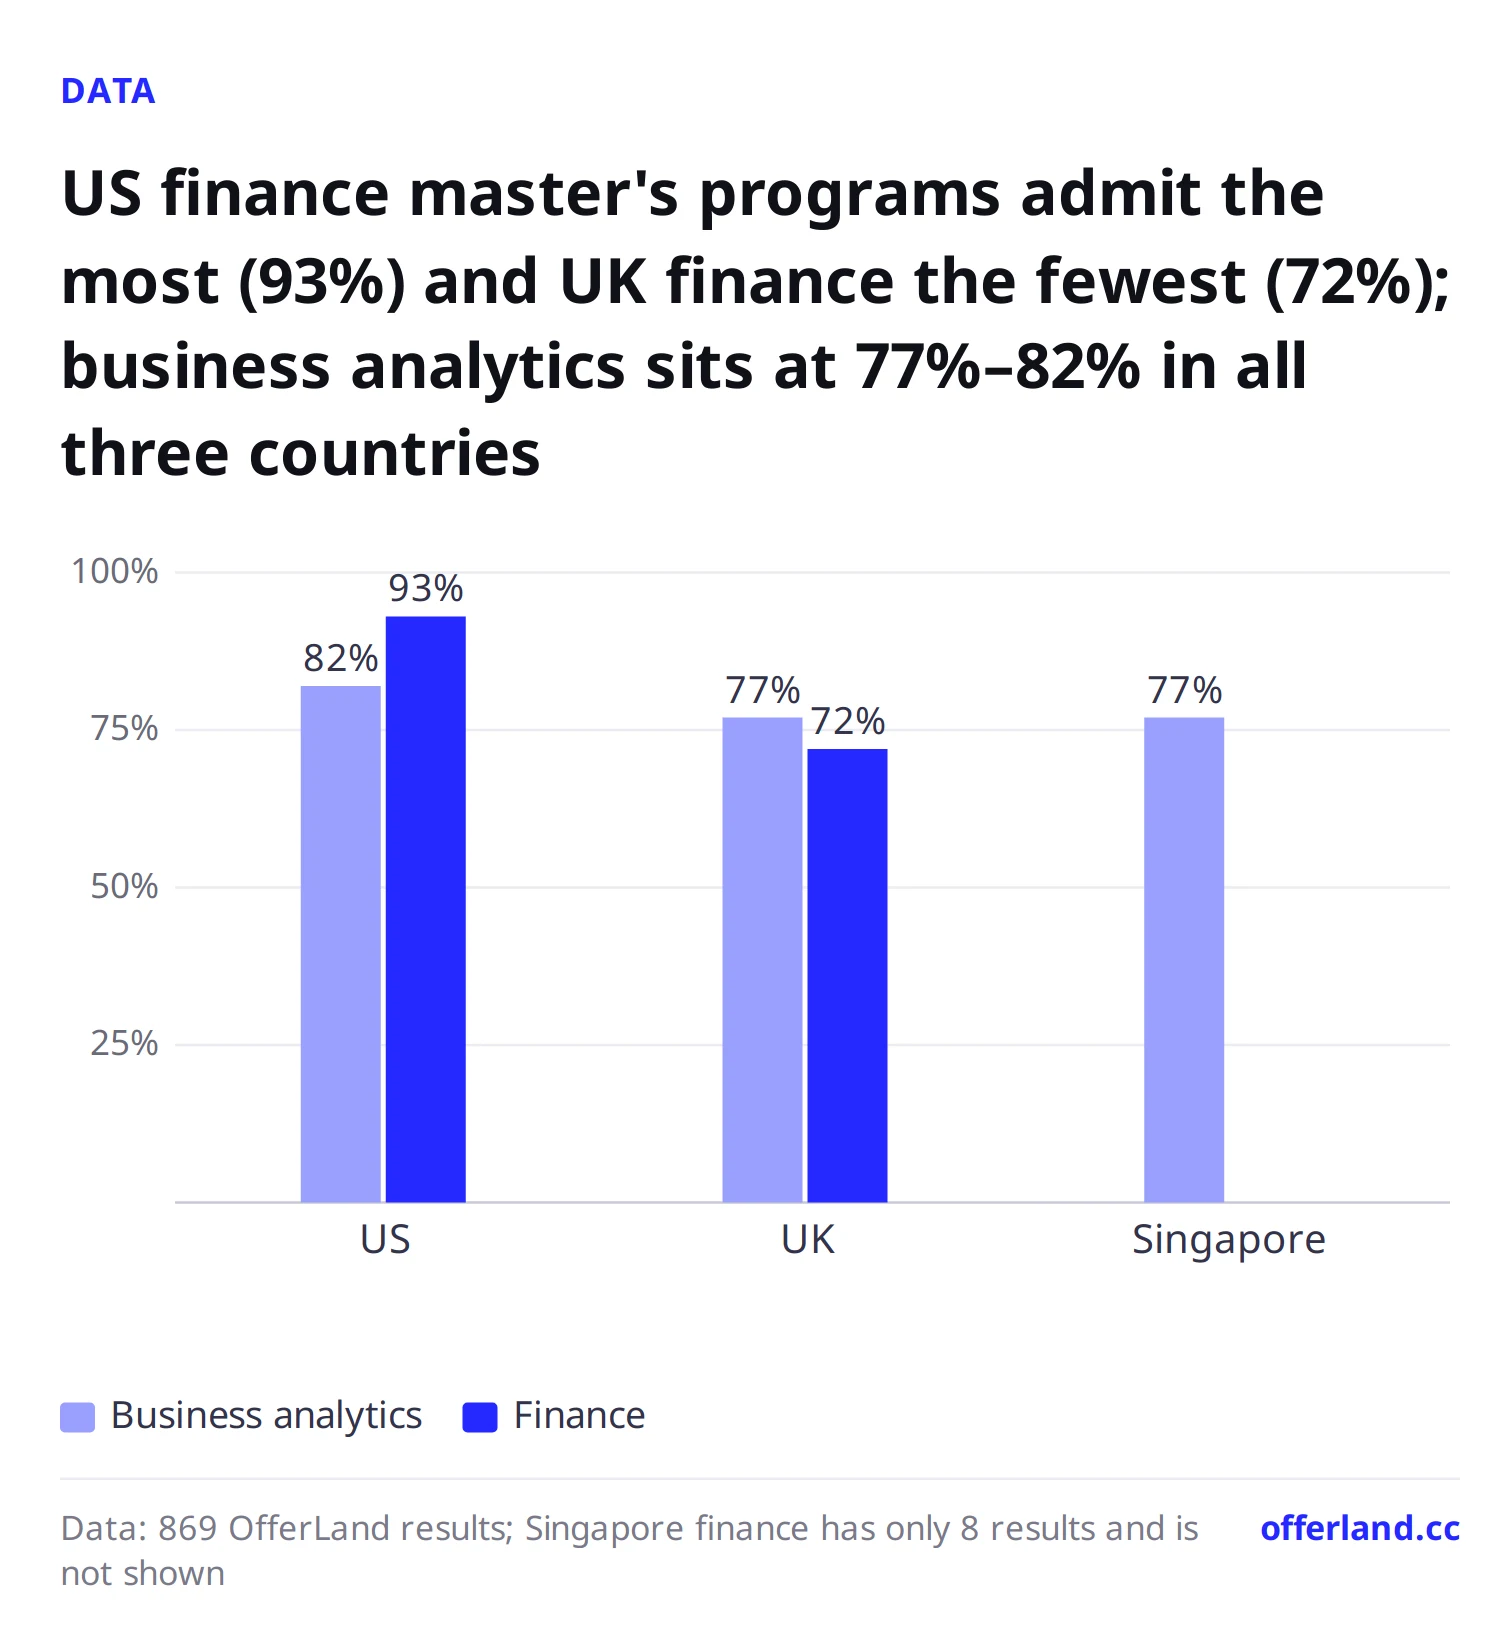
Among 869 business analytics and finance master's application results on OfferLand, US finance master's programs have the highest admit rate (93%) and UK finance master's the lowest (72%), while business analytics sits between 77% and 82% in the US, the UK and Singapore alike. Admitted applicants have a median GPA of about 3.60, TOEFL of about 100 and GRE of about 321, almost identical across business analytics and finance. What really separates outcomes is the school: popular programs such as those at UCL, LSE and UT Austin admit only 30% to 50%.
Key takeaways
Business analytics master's admit rates: US 82% (296 results), UK 77% (88 results), Singapore 77% (22 results).
Finance master's admit rates: US 93% (215 results), UK 72% (211 results). UK finance had more than 4 times as many rejections as US finance (60 vs. 14).
Admitted applicants' scores: median GPA is around 3.60 in both fields (on a 4.0 scale), TOEFL 100–101 and GRE 321.
Among admitted applicants, 34% in business analytics reported a GRE score, compared with only 14% in finance; US MSBA applicants are more likely to submit the GRE.
Admitted applicants in the UK have a higher median GPA than in the US: 3.80 for UK business analytics versus 3.60 for US business analytics.
Admit rates in three countries: UK finance is the most competitive
Admit rate in the table below is "admitted ÷ (admitted + rejected)"; waitlisted and pending results are left out.
Field | Country | Admitted + rejected | Admitted | Rejected | Admit rate |
|---|---|---|---|---|---|
Business Analytics | United States | 296 | 243 | 53 | 82% |
Business Analytics | United Kingdom | 88 | 68 | 20 | 77% |
Business Analytics | Singapore | 22 | 17 | 5 | 77% |
Business Analytics | Other (Ireland, Canada, etc.) | 14 | 14 | 0 | 100% |
Finance and Investment | United States | 215 | 201 | 14 | 93% |
Finance and Investment | United Kingdom | 211 | 151 | 60 | 72% |
Finance and Investment | Singapore + other | 16 | 14 | 2 | 88% |
Singapore finance has only 8 results, too few to mean much on its own, so it is merged with the other countries. Across both fields, Singapore has 30 results with an 80% admit rate.
Splitting schools into ranking tiers makes the gaps clearer. US schools use the US News 2027 national ranking and UK schools use QS 2027.
Field | Country | Ranking tier | Results | Admit rate |
|---|---|---|---|---|
Business Analytics | United States | US News 1–20 | 56 | 71% |
Business Analytics | United States | US News 21–50 | 132 | 77% |
Business Analytics | United States | US News 51 and below, or unranked | 108 | 94% |
Business Analytics | United Kingdom | QS 1–50 | 39 | 62% |
Business Analytics | United Kingdom | QS 51–100 | 37 | 86% |
Finance and Investment | United States | US News 1–20 | 29 | 79% |
Finance and Investment | United States | US News 21–50 | 113 | 93% |
Finance and Investment | United Kingdom | QS 1–50 | 95 | 74% |
Finance and Investment | United Kingdom | QS 51–100 | 79 | 62% |
Finance and Investment | United Kingdom | QS 101 and below, or unranked | 37 | 86% |
In UK finance, the QS 51–100 tier is actually the hardest, because LSE (QS 62) falls in this tier and LSE's finance programs admit fewer than half of applicants.
Popular schools: at least 5 results each
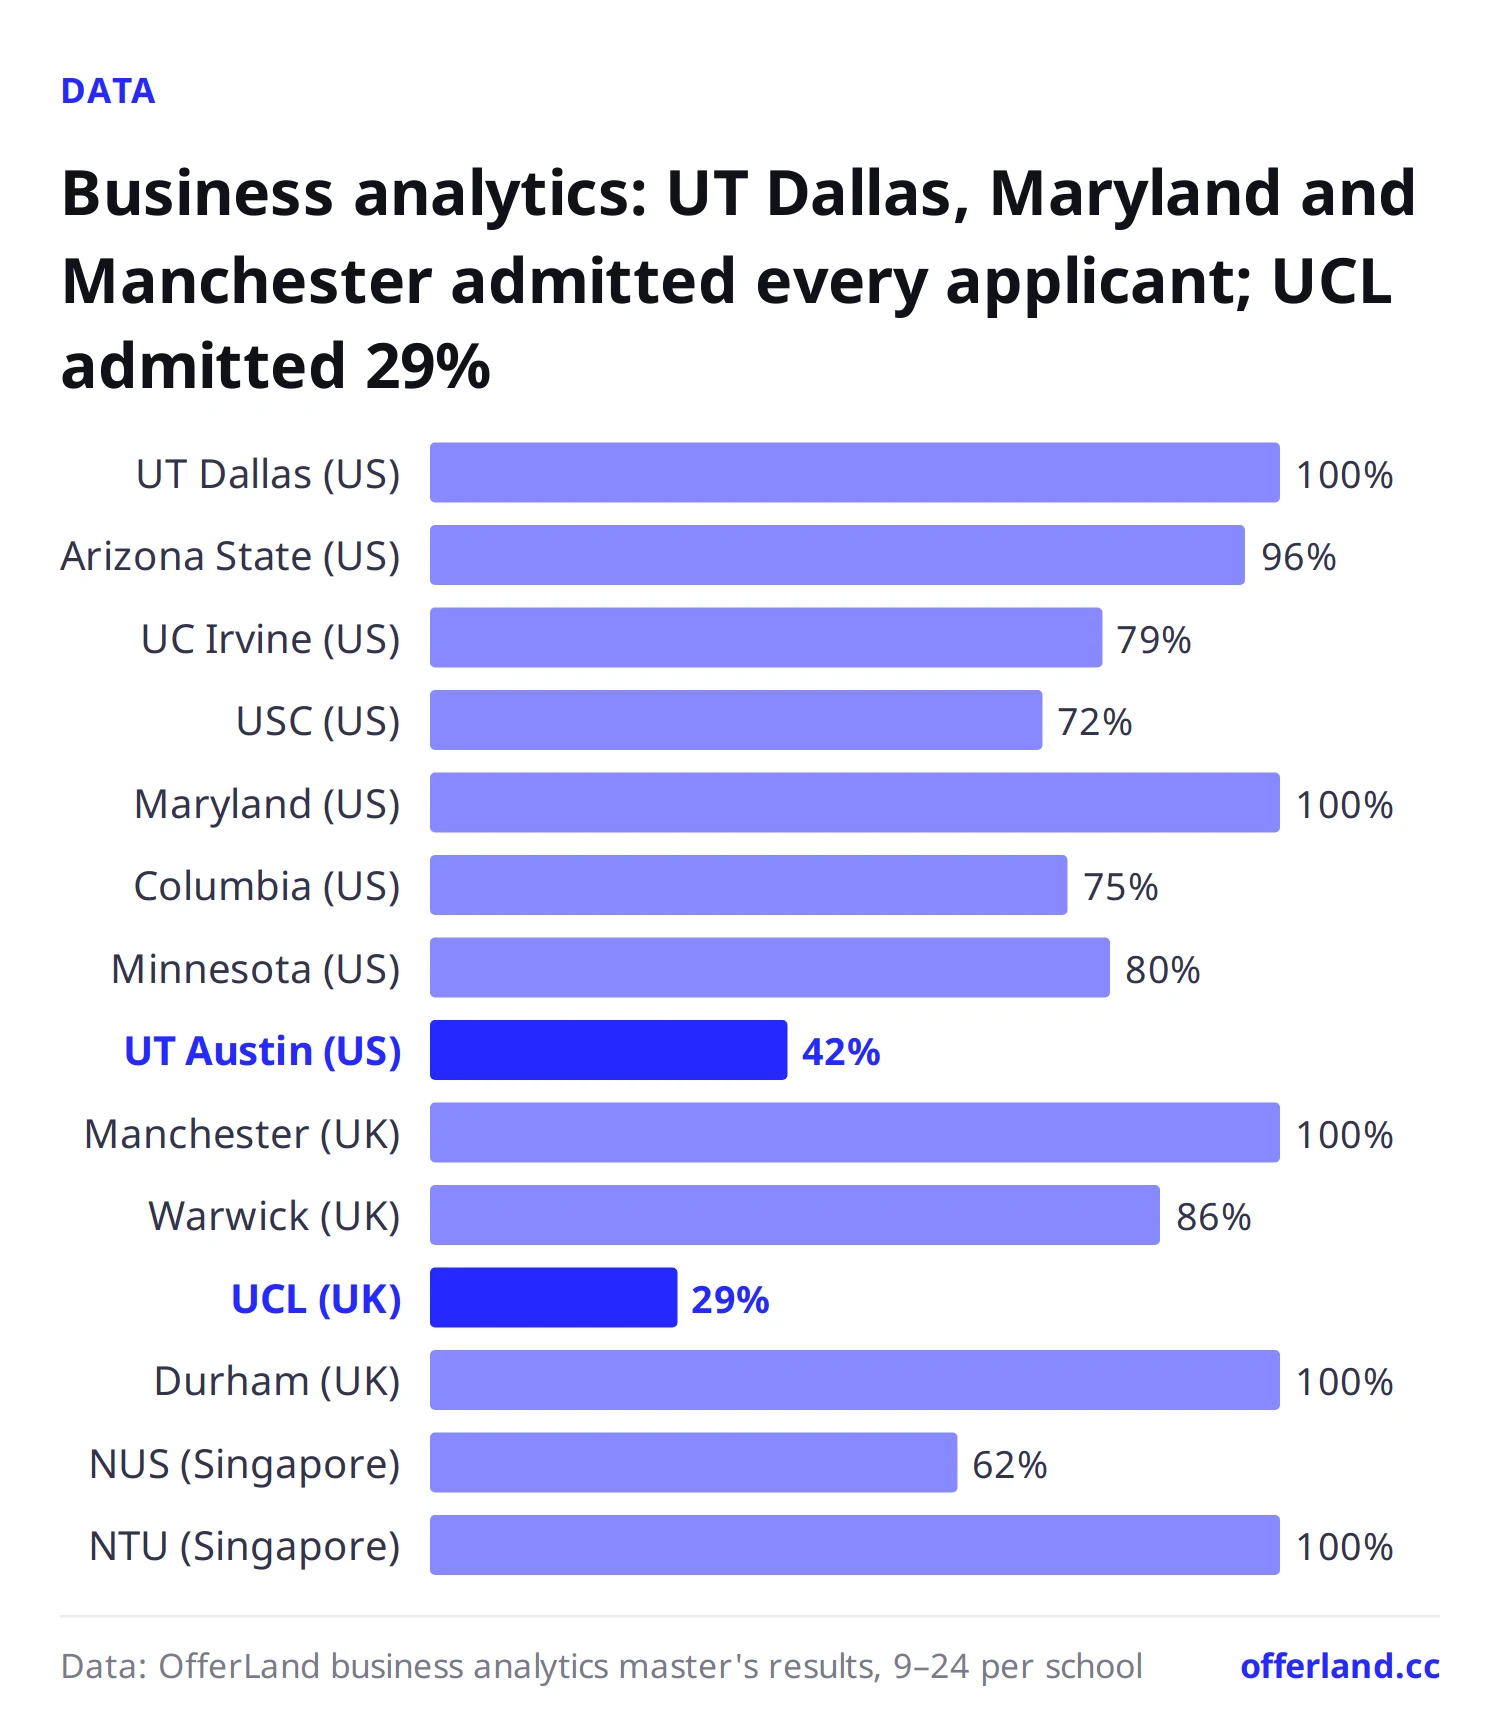
Only schools with at least 5 results within a single field are listed. In business analytics, UT Dallas, ASU and Maryland in the US admit almost everyone, while UT Austin and UCL rejected more applicants than they admitted.
School | Country | Results | Admit rate |
|---|---|---|---|
UT Dallas | United States | 24 | 100% |
Arizona State | United States | 23 | 96% |
UC Irvine | United States | 19 | 79% |
USC | United States | 18 | 72% |
Maryland | United States | 17 | 100% |
Columbia | United States | 16 | 75% |
Minnesota | United States | 15 | 80% |
UT Austin | United States | 12 | 42% |
Manchester | United Kingdom | 16 | 100% |
Warwick | United Kingdom | 14 | 86% |
UCL | United Kingdom | 14 | 29% |
Durham | United Kingdom | 10 | 100% |
NUS | Singapore | 13 | 62% |
NTU | Singapore | 9 | 100% |
Columbia's 16 results are split between two programs: the M.S. in Business Analytics (MSBA) with 7 results and 5 admits, and the MS in Applied Analytics with 9 results and 7 admits. The MSAFA (Accounting & Fundamental Analysis), often searched alongside them, is classified under accounting on the site and has too few results, so it is not included here. In the UK, UCL Business Analytics MSc is the hardest business analytics program across the three countries. The two Singapore schools differ a lot: NUS MSBA admitted 5 of 9, while NTU MSBA admitted all 9.
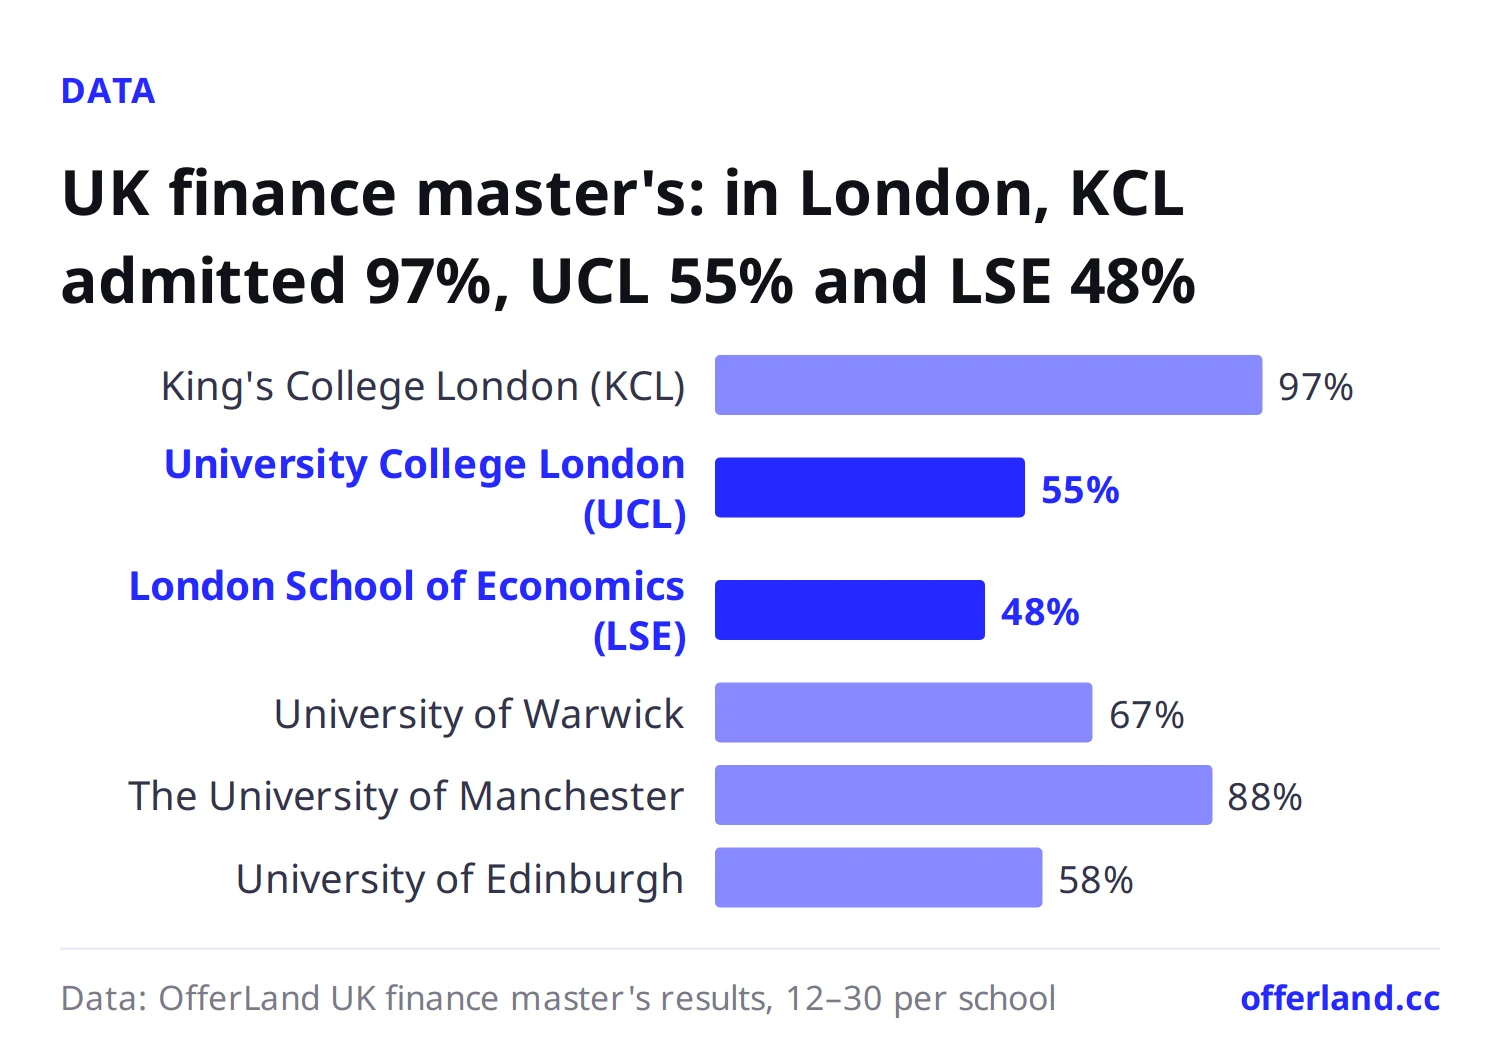
In finance, mid-ranked US schools have very high admit rates, while UCL and LSE in London are clearly lower.
School | Country | Results | Admit rate |
|---|---|---|---|
UIUC | United States | 27 | 100% |
Boston College | United States | 14 | 79% |
Maryland | United States | 14 | 100% |
UT Dallas | United States | 13 | 100% |
UC Irvine | United States | 12 | 100% |
WashU | United States | 11 | 100% |
Johns Hopkins | United States | 10 | 100% |
Columbia | United States | 5 | 20% |
King's College London | United Kingdom | 30 | 97% |
UCL | United Kingdom | 29 | 55% |
LSE | United Kingdom | 25 | 48% |
Warwick | United Kingdom | 18 | 67% |
Manchester | United Kingdom | 16 | 88% |
Edinburgh | United Kingdom | 12 | 58% |
NUS | Singapore | 7 | 86% |
The most-reported US finance program is UIUC M.S. in Finance, with all 27 results admitted. In the UK, KCL Finance (Asset Pricing) MSc admitted all 13, while UCL Finance MSc, also in London, admitted only 10 of 19. LSE's finance programs had 25 results combined, with 12 admits. Columbia's 5 finance results are all Financial Engineering, which is more quantitative and not directly comparable to a typical MSF.
Admitted applicants' scores: how business analytics and finance differ
The table below counts only users who got at least one admit in the field, using each person's highest score; GPA uses the 4.0 scale only. The medians for the two fields almost overlap.
Measure | Business Analytics | Finance and Investment |
|---|---|---|
Admitted applicants | 172 | 164 |
Median GPA (25th–75th percentile) | 3.61 (3.39–3.80), n=74 | 3.60 (3.41–3.85), n=86 |
Median TOEFL (25th–75th percentile) | 100 (95–104), n=88 | 101 (96–103), n=91 |
Median IELTS (25th–75th percentile) | 7.0 (6.5–7.0), n=55 | 7.0 (7.0–7.5), n=58 |
Median GRE (25th–75th percentile) | 321 (318–323), n=58 | 321 (318–324), n=23 |
Share reporting a GRE score | 34% | 14% |
The difference is the GRE: a third of admitted business analytics applicants reported a GRE score, compared with just over 10% in finance. In the US, it's 45/120 (38%) for business analytics and 12/93 (13%) for finance. The median GRE Quant score is between 168 and 170 in both fields.
Broken down by country, admitted applicants in the UK have a clearly higher GPA than in the US.
Field | Country | Admitted applicants | Median GPA | Median TOEFL | Median IELTS | Median GRE |
|---|---|---|---|---|---|---|
Business Analytics | United States | 120 | 3.60 (n=53) | 100 (n=77) | 7.0 (n=21) | 321 (n=45) |
Business Analytics | United Kingdom | 37 | 3.80 (n=15) | Too few results | 7.0 (n=20) | 321 (n=5) |
Finance and Investment | United States | 93 | 3.58 (n=51) | 100 (n=72) | 7.0 (n=8) | 321.5 (n=12) |
Finance and Investment | United Kingdom | 72 | 3.68 (n=30) | 102 (n=14) | 7.0 (n=46) | 321 (n=8) |
Both fields combined | Singapore | 19 | Too few results | 105 (n=7) | 7.0 (n=8) | 323 (n=7) |
UK schools put more weight on GPA and undergraduate school background, and admitted applicants' median GPA is 0.1–0.2 higher than in the US. Too few Singapore applicants reported a GPA, but their median TOEFL and GRE are the highest of the three countries.
How to use this data
Tier your school list: within each field, treat programs with admit rates below 50%, such as UCL, LSE, UT Austin and Columbia's financial engineering, as reach schools. US finance programs ranked 21–50 by US News have admit rates above 90% in this sample and can go in the safer part of your list.
Don't apply only to London for UK finance: KCL, UCL and LSE are all in London, but their results differ a lot. If you want London, consider also applying to KCL, or to Warwick or Manchester, to spread the risk.
Business analytics and the GRE: if you're mainly targeting US MSBA programs, nearly 40% of admitted applicants submitted a GRE score, with a median of 321. If your GPA is below 3.4, the GRE is the most direct way to strengthen your application. Fewer finance master's applicants submit the GRE, but a high Quant score still helps.
The UK looks at GPA: admitted applicants in the UK have a median GPA of 3.68–3.80. If your GPA is on the low side, your chances at top UK schools will be smaller than at mid-ranked US schools.
Look at the two Singapore schools separately: NTU business analytics admitted everyone in this sample, while NUS business analytics admitted about 60%.
For more detailed numbers on individual schools, use the admission results search to filter by school and program.
These are all historical results reported on OfferLand. They can only help you estimate relative difficulty and do not guarantee admission.
FAQ
What is the MSBA admit rate? In OfferLand's sample, business analytics master's admit rates are 82% in the US, 77% in the UK and 77% in Singapore. Popular programs vary widely: UCL is at 29% and UT Austin at 42%, while UT Dallas and Maryland admitted everyone.
What GPA and TOEFL do you need for an MSBA? Admitted applicants have a median GPA of 3.61 (on a 4.0 scale, with the middle half between 3.39 and 3.80), a median TOEFL of 100 and IELTS of 7.0. Admitted business analytics applicants in the UK have a higher median GPA, about 3.80.
Is it easier to get into business analytics or a finance master's? Overall admit rates are similar (81% for business analytics, 83% for finance), and score thresholds are close too. The difference is the country: in the US, finance is easier than business analytics (93% vs. 82%), while in the UK it's the reverse, with finance at 72% and business analytics at 77%.
Do you need the GRE for an MSBA? Not necessarily, but 38% of admitted US business analytics applicants reported a GRE score, with a median of 321; in finance master's programs, only 14% did. Whether it's required depends on each school's rules for that year.
Data methodology
"Taiwanese students" refers to OfferLand users: the site's users are mainly students from Taiwan, but the data is self-reported, there is no nationality field, and it is not official school data.
Sample: master's (Masters) application results reported by OfferLand users whose primary field (is_primary) is "Business Analytics" or "Finance and Investment": 869 results in total (423 business analytics, 446 finance), reported between 2015 and 2026, with about 74% from 2023–2025. Data as of 2026-10-12.
Admit rate: (admitted + admitted and enrolled) ÷ (admitted + admitted and enrolled + rejected). The 7 waitlisted and pending results are left out.
Countries: Singapore finance has only 8 results, so in the admit rate table it is merged with "other countries outside Singapore"; the Singapore row in the score table combines both fields.
The school tables list only schools with at least 5 results within a single field; any cell with fewer than 5 people is marked "Too few results".
Scores: calculated for users who got at least one admit in the field, using each person's highest score. GPA uses only data on a 4.0 scale between 0 and 4; 4.3-scale and percentage grades are excluded. Medians and 25th/75th percentiles are calculated with percentile_cont.
Rankings: US schools use the US News 2027 national ranking, UK schools use QS 2027.
These are statistics from OfferLand's own sample, self-reported by users, not official school data. Admitted applicants are more willing to report, so admit rates may be higher than in reality. The data is best used to compare relative difficulty between schools.
Further reading
OfferLand editorial team · Jason · Last updated 2026-11-04 · About the editorial team
See which schools admitted applicants with a background like yours
Search resultsSchools in this post
- University College London (UCL)
- The London School of Economics and Political Science (LSE)
- University of Texas at Austin (UT Austin)
- King's College London (KCL)
- University of Texas Dallas (UT Dallas, UTD)
- National University of Singapore (NUS)
See each school's applicant numbers, admit rates and past applicants' results
See admission data for these schools