Translated by OfferLand from the original Traditional Chinese post. View original

OfferLand
Nov 14
Canada vs. Singapore vs. Australia Master's Admissions: 239 Results Compared
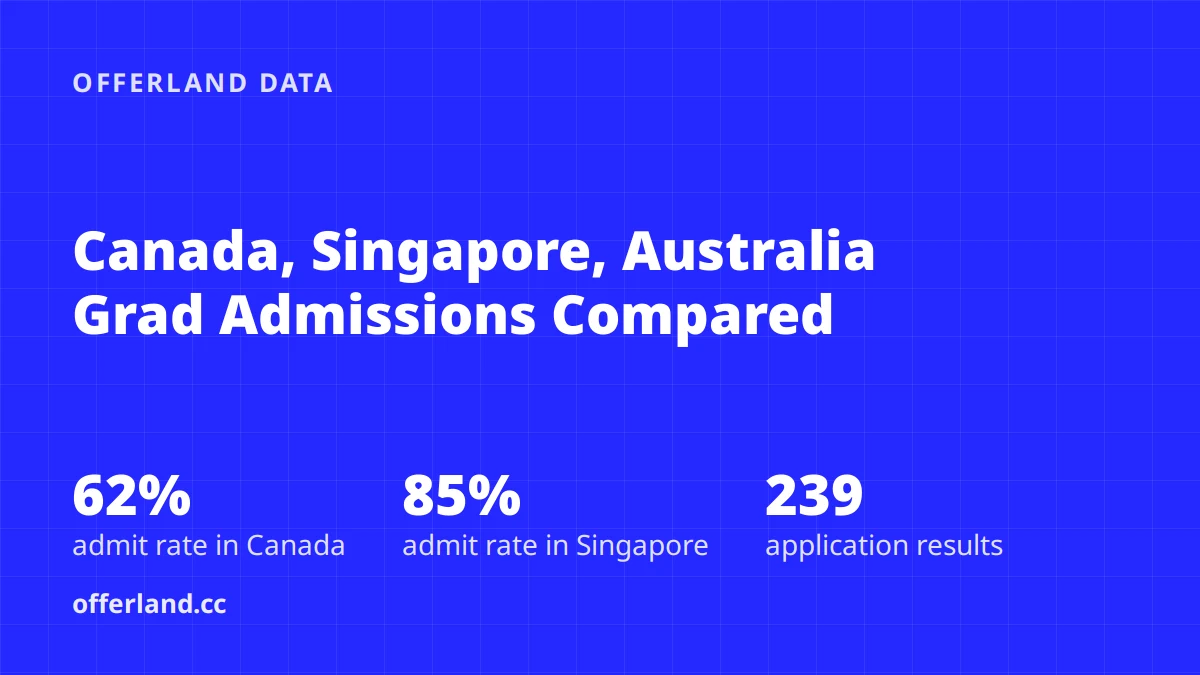
In OfferLand's sample, Canada, Singapore and Australia are three very different kinds of applications. Canada's admit rate is 62%, most applicants also apply to the US, and programs are mostly electrical engineering, computer science and engineering. Singapore's is 85%, almost entirely concentrated in business and business analytics at three schools: NUS, NTU and SMU. In Australia, 87 of 88 results are admits. That comes from reporting bias and can't be read as a 99% admit rate for Australia.
Key points
Canada: 83 results, 51 admits and 31 rejections, a 62% admit rate. 42 of the 51 applicants also applied to US schools.
Singapore: 68 results, 57 admits and 10 rejections, an 85% admit rate. NUS alone accounts for 40 results, with a 75% admit rate.
Australia: only 1 rejection among 88 results. Few people report rejections, so this article doesn't calculate an admit rate for Australia.
The most popular fields differ a lot: Canada's top two are Electrical Engineering and Computer Science (26 results) and General Engineering (13); Singapore's is Business Analytics (22); Australia's is Business Administration (25).
The median IELTS score of admitted applicants is 7.0 in both Canada and Singapore, and 6.5 in Australia.
The three countries at a glance
The three countries have similar sample sizes, but very different shares of admits and rejections.
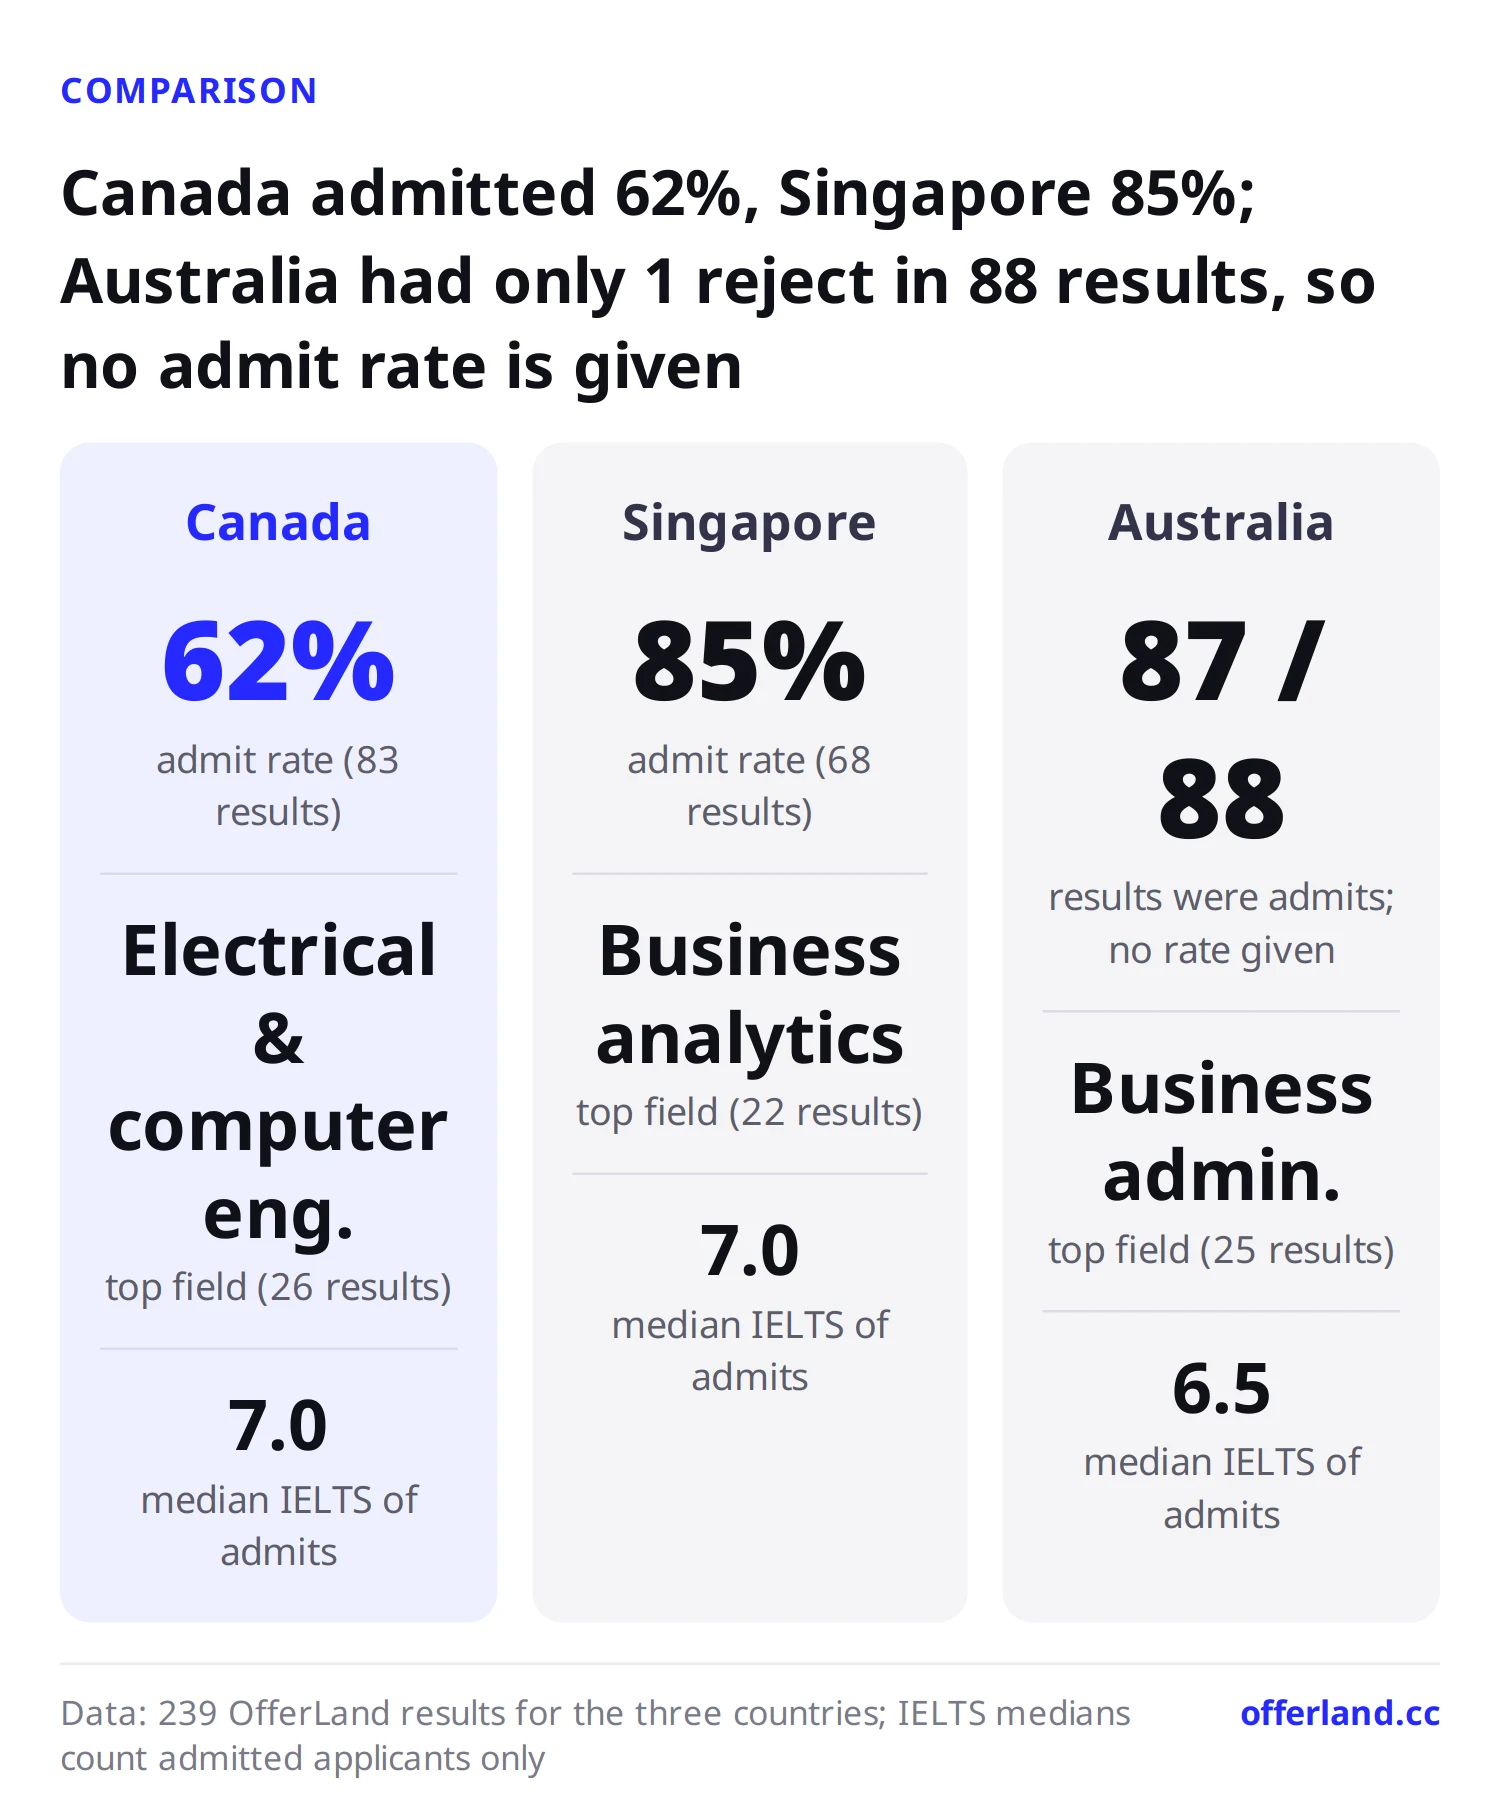
Country | Results | Applicants | Admits | Rejections | Admit rate |
|---|---|---|---|---|---|
Canada | 83 | 51 | 51 | 31 | 62% |
Singapore | 68 | 43 | 57 | 10 | 85% |
Australia | 88 | 52 | 87 | 1 | Not calculated (see below) |
Canada and Singapore each have 1 pending result, which is left out of the denominator. In all three countries most results are for master's degrees: 74 in Canada, 65 in Singapore and 81 in Australia. The rest are a small number of bachelor's, PhD and MBA results.
Read the Australian numbers with care. Only 1 of the 88 results is a rejection, and 26 are older data from before 2022. The most reasonable explanation is reporting bias: users usually come to share only after they get an offer, and few report rejections. Conditional offers are also common for Australian taught master's programs, so applicants are less likely to log a "not admitted" as a result. Australia's data is useful for seeing which schools and programs people apply to, not for estimating your chances of admission.
How much applicants overlap with the US and UK also differs. 42 of Canada's 51 applicants also have US results, which suggests many people treat Canada as a second track alongside the US. In Singapore, 13 applicants also applied to the UK. Among Australia's 52 applicants, only 9 have US results and only 9 have UK results.
Canada: the lowest admit rate, with popular schools concentrated in three
Canada has the highest share of rejections of the three countries; at Waterloo, 6 of 10 results were rejections. The table lists schools with at least 5 results and combines the rest.
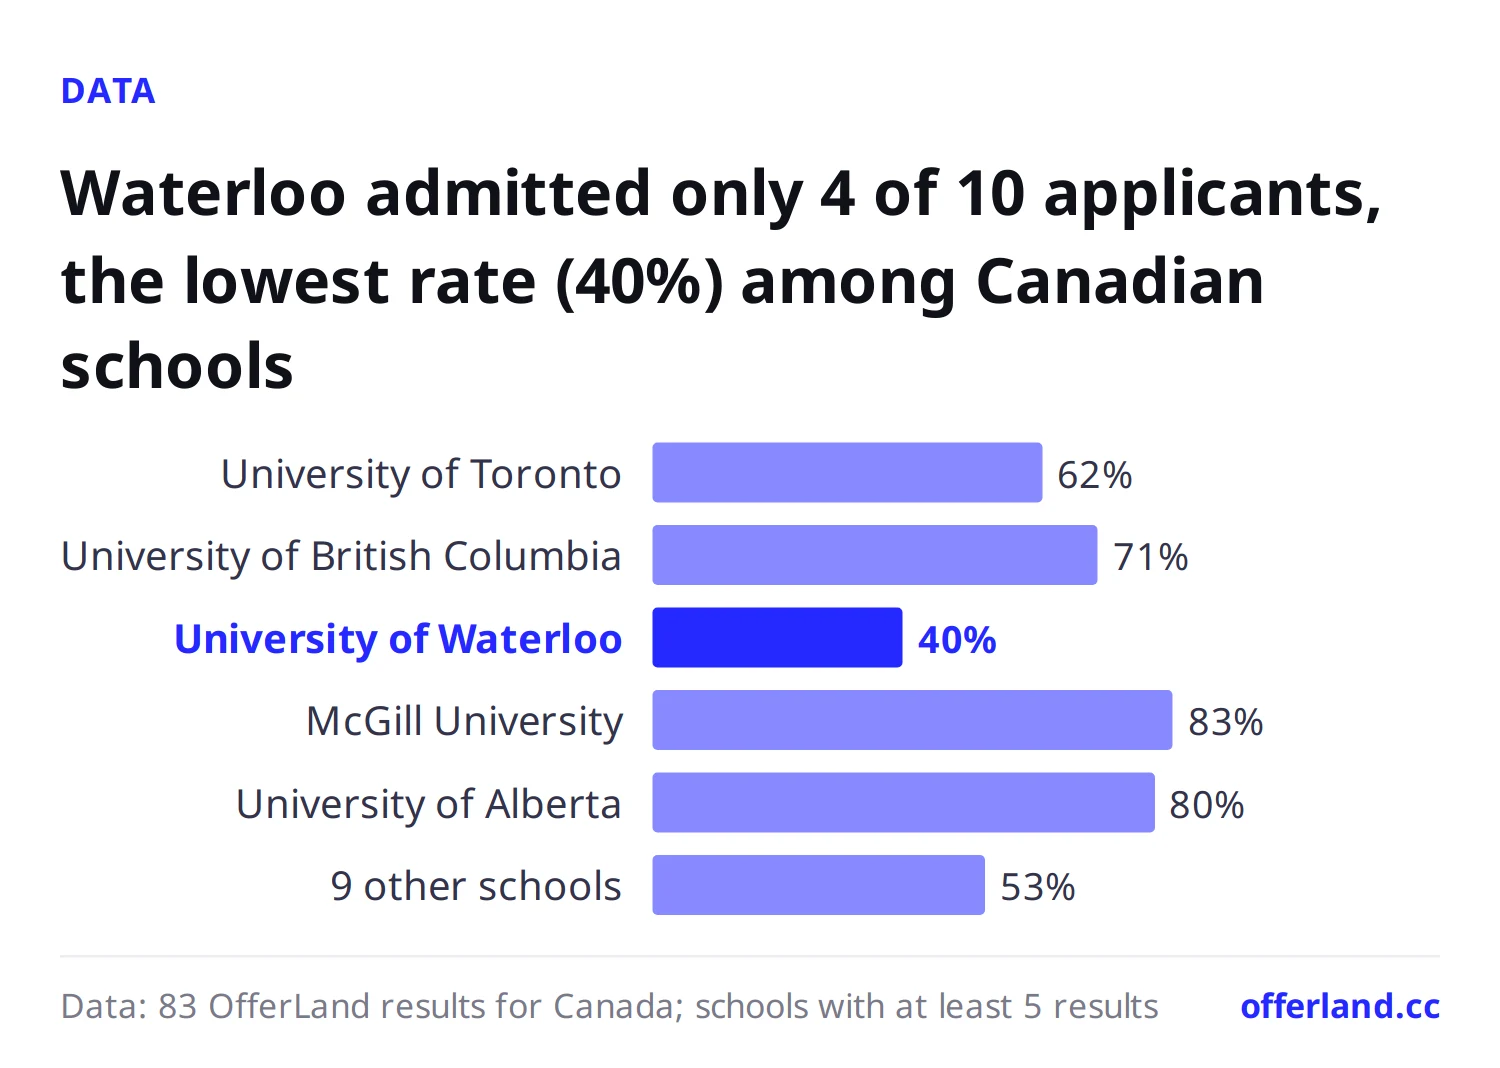
School | QS 2027 | Admits | Rejections | Admit rate |
|---|---|---|---|---|
32 | 13 | 8 | 62% | |
45 | 15 | 6 | 71% | |
113 | 4 | 6 | 40% | |
30 | 5 | 1 | 83% | |
University of Alberta | 96 | 4 | 1 | 80% |
9 other schools combined | 10 | 9 | 53% |
By field, Canada's sample is most concentrated in science and engineering.
Field | Results | Admits | Rejections | Admit rate |
|---|---|---|---|---|
Electrical Engineering and Computer Science | 26 | 16 | 10 | 62% |
General Engineering | 13 | 9 | 4 | 69% |
Business Administration (MBA/MiM) | 6 | 5 | 1 | 83% |
Architecture | 6 | 1 | 5 | 17% |
Business Analytics | 5 | 5 | 0 | 100% |
Other fields combined | 27 | 15 | 11 | 58% |
The programs with the most results in the sample are UBC's Master of Business Analytics (5 results, all admits) and the University of Toronto's MScAC (5 results, 3 admits). The two differ quite a bit in length: UBC's website lists MBAN at 12 months, including a 4-month industry project, and U of T's computer science department lists MScAC at 16 months, with 8 months of coursework followed by an 8-month applied research internship at a partner company. Canadian engineering and science master's programs are also often split into course-based and thesis-based tracks, which differ in time and funding, so check which one a program is before you add it to your list.
Singapore: three schools, business master's of about a year
Singapore's entire sample is from three schools, and nobody reported a rejection from NTU or SMU.
Singapore's mix of fields is nearly the opposite of Canada's: business fields make up the bulk.
Field | Results | Admits | Rejections | Admit rate |
|---|---|---|---|---|
Business Analytics | 22 | 17 | 5 | 77% |
Business Administration (MBA/MiM) | 10 | 8 | 2 | 80% |
Finance and Investment | 9 | 7 | 1 | 88% |
General Engineering | 6 | 6 | 0 | 100% |
Marketing | 5 | 5 | 0 | 100% |
Information Technology | 5 | 5 | 0 | 100% |
Other fields combined | 11 | 9 | 2 | 82% |
Among individual programs, NUS MSBA and NTU's business analytics master's have 9 results each; NUS had 4 rejections, while NTU admitted everyone. SMU's MITB has 5 results, all admits. A separate column compares business analytics and finance master's programs across countries, so we won't go into that here.
Taught master's programs in Singapore tend to be short. NTU's website lists its business analytics master's as one year full-time; NUS's business analytics master's is 13 months full-time. To learn more about choosing among master's programs at NUS's schools, see Studying in Singapore: How to Choose an NUS Master's.
Australia: look at where people apply, not the admit rate
For Australia we skip the admit rate and only look at where people applied. The top five are all Group of Eight universities.
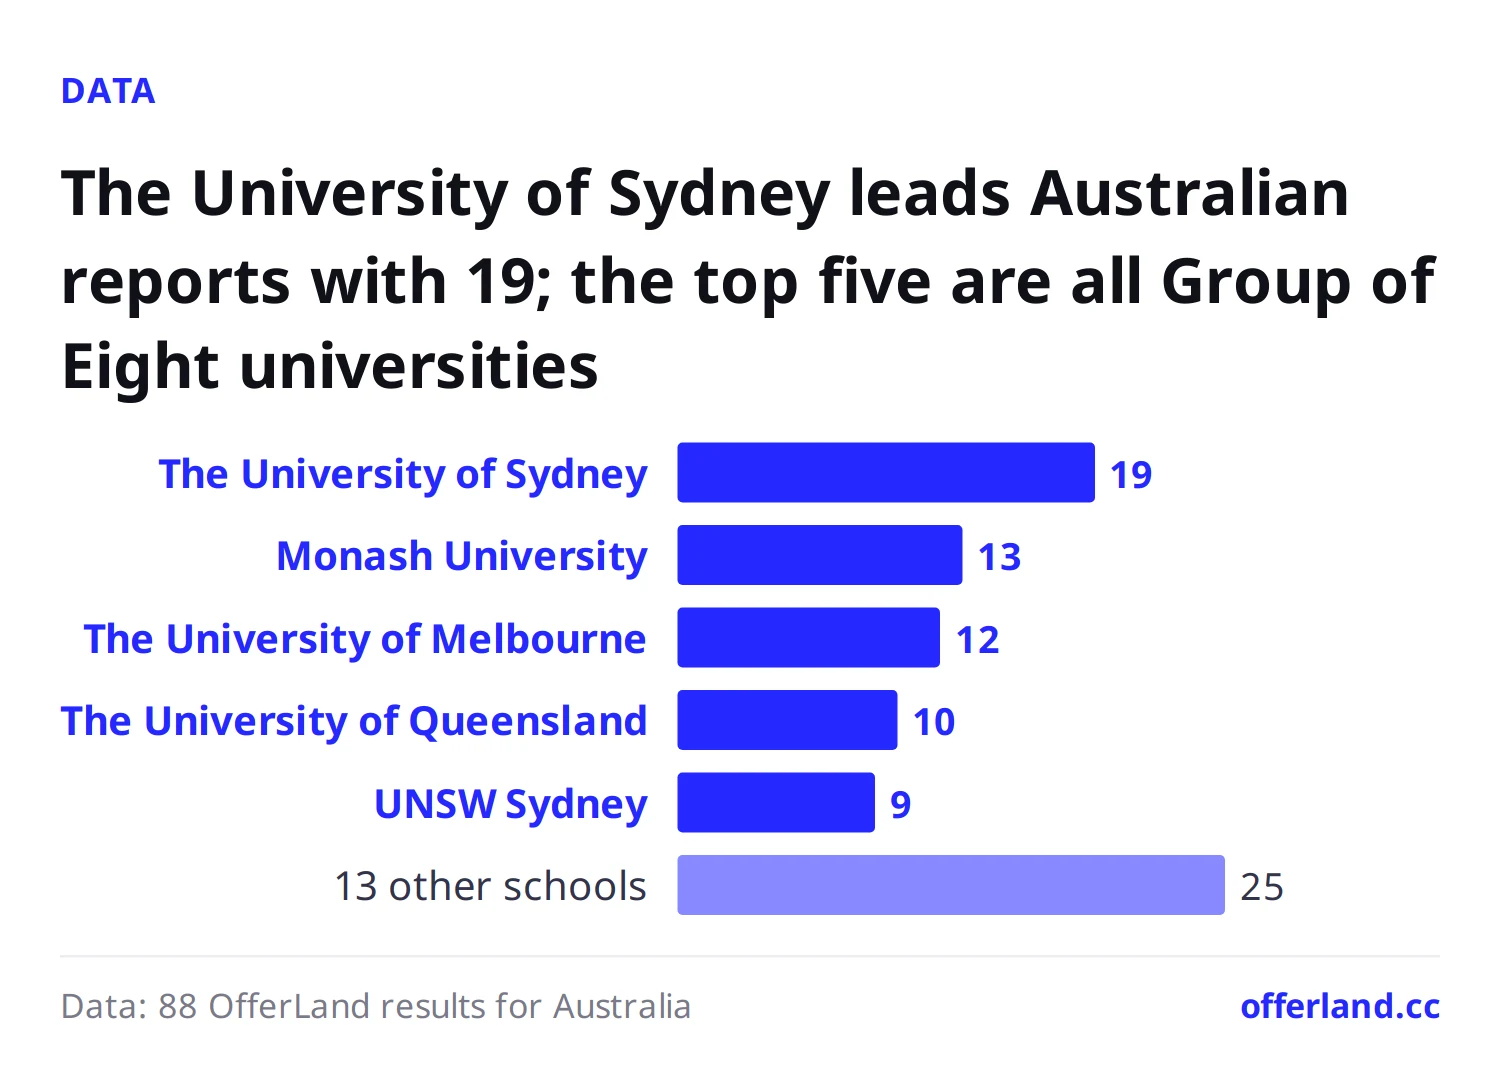
School | QS 2027 | Reported results |
|---|---|---|
28 | 19 | |
31 | 13 | |
22 | 12 | |
The University of Queensland | 40 | 10 |
UNSW Sydney | 19 | 9 |
13 other schools combined | 25 |
Field | Reported results |
|---|---|
Business Administration (MBA/MiM) | 25 |
Information Technology | 13 |
Human Resources | 12 |
Design | 5 |
Other fields combined | 33 |
The most common single program is the University of Sydney's Master of Commerce, with 13 results. Information technology also has 13. People often use Australian IT master's programs to switch fields, for example Monash's Master of Information Technology (2 years). In OfferLand's program data, Monash has both a 1-year commerce master's and a 2-year IT master's. The length of an Australian master's often depends on whether your undergraduate background is related, so check the school's website for the exact duration.
GPA and language scores of admitted applicants
The table covers applicants with at least one admit, each counted once. GPAs on a 4.0 scale and a 4.3 scale are reported separately, not mixed.
Country | Median GPA, 4.0 scale (applicants) | Median GPA, 4.3 scale (applicants) | Median TOEFL (applicants) | Median IELTS (applicants) |
|---|---|---|---|---|
Canada | 3.52 (9) | 3.88 (23) | 102 (17) | 7.0 (14) |
Singapore | 3.80 (7) | 3.85 (17) | 103 (9) | 7.0 (17) |
Australia | 3.18 (27) | 3.59 (10) | 100 (7) | 6.5 (28) |
The middle 50% of Canada's admitted applicants on a 4.3 scale fall between 3.82 and 3.99; in Singapore it's 3.70 to 3.91. Both are on the high side. Australia's admitted applicants on a 4.0 scale have a median of 3.18 and a median IELTS of 6.5, with three quarters at 7.0 or below. But Australia's sample of admitted applicants is affected by the same reporting bias, so you can't infer that "a 3.2 GPA will definitely get you in."
How to use this data
Applying to Canada for EECS or engineering: prepare as if the competition were on par with the US. Besides the University of Toronto and UBC, Waterloo has a high share of rejections, so it's best to include a few schools with steadier admit rates on your list.
Going to Singapore for business: NUS is where competition is most concentrated, with a quarter of the sample rejected; NTU and SMU can be the safer options on the same list. Admitted applicants' median GPA on a 4.3 scale is around 3.85, so applicants with a lower GPA need work experience or a quantitative background to make up for it.
Going to Australia: first check each program's entry requirements (related background, IELTS subscores) and length. Almost no one on the site has reported a rejection, but that doesn't mean you can apply to fewer schools.
To see where people with a similar background were admitted, use the OfferLand admission results search and filter by school and program.
FAQ
Is it easy to get into a master's program in Canada?In OfferLand's sample, Canada's admit rate is 62%, the lowest of the three countries. EECS has 26 results with a 62% admit rate, and Waterloo admitted only 4 of 10. Most Canadian applicants also apply to the US, and the competition is close to US levels.
How long is a master's in Singapore?Many taught master's programs take about a year. NTU's website lists its business analytics master's as one year full-time, and NUS's business analytics master's is 13 months full-time. Programs vary a lot, so check each school's website.
Is the admit rate for Australian master's programs really high?Only 1 of OfferLand's 88 Australian results is a rejection, but that's because users mostly report admits, so it can't be taken as the real admit rate. What you can use is the mix of popular schools and programs: the University of Sydney, Monash and the University of Melbourne come up most, and programs are mostly in business and information technology.
Should I take the IELTS or the TOEFL for Singapore or Canada?People use both. Among admitted applicants, the median IELTS is 7.0 in both Canada and Singapore, and the median TOEFL is 102 and 103 respectively. Check each school's website for program minimums and subscore requirements.
Further reading
Data methodology
Source: OfferLand's own sample, self-reported by users, not official school data. "Taiwanese students" means OfferLand users; the site has no nationality field.
Scope: application results for schools in Canada, Singapore and Australia, 239 in total, covering all degrees (220 master's results; the rest are bachelor's, PhD and MBA). Data as of 2026-10-17.
Admit rate: (admitted + admitted and enrolled) ÷ (admitted + admitted and enrolled + rejected). The 2 pending results are left out of the denominator. Australia has so few rejections that no admit rate is calculated.
Fields: each program is classified by its main field. Schools or fields with fewer than 5 results are combined into "Other."
GPA and language scores: calculated from applicants with at least one admit, each counted once. Only 4.0-scale (0 to 4.0) and 4.3-scale (0 to 4.3) GPAs are used, and they are counted separately. Language scores use each person's highest total score. Fewer than 10 people are in the 4.0-scale groups for Canada and Singapore, so treat those as indicative only.
Rankings: QS 2027.
Program length (checked 2026-10-17): UBC graduate school's Master of Business Analytics page (12 months, including a 4-month industry project); U of T computer science department's Graduate Programs page (MScAC, 16 months: 8 months of coursework plus an 8-month internship); NTU's admissions page for its business analytics master's (one year full-time); the NUS Business Analytics Centre master's page (13 months full-time). For Australian program lengths, rely on each school's latest official information.
Users are generally more willing to report admits, so actual admit rates in all three countries may be lower than shown here. Use the numbers for relative comparison, not as your chances of admission.
OfferLand editorial team · Jason · Last updated 2026-11-14 · About the editorial team
See which schools admitted applicants with a background like yours
Search resultsSchools in this post
- National University of Singapore (NUS)
- University of Toronto
- University of British Columbia (UBC)
- The University of Sydney
- The University of Melbourne
- The University of New South Wales (UNSW Sydney)
See each school's applicant numbers, admit rates and past applicants' results
See admission data for these schools